آخر المواضيع المضافة

 تاريخ الرياضيات
الرياضيات في الحضارات المختلفة
الرياضيات المتقطعة
الجبر
الهندسة
المعادلات التفاضلية و التكاملية
التحليل
علماء الرياضيات
تاريخ الرياضيات
الرياضيات في الحضارات المختلفة
الرياضيات المتقطعة
الجبر
الهندسة
المعادلات التفاضلية و التكاملية
التحليل
علماء الرياضيات | Quartiles: The Boxplot |


|
|
Read More
Date: 9-3-2021
Date: 4-5-2021
Date: 16-4-2021
|
In addition to central tendency, we can measure how close a distribution is to its mean and median and how much the readings vary—what we might call the spread of the data.
One very simple measure is the range of the distribution, the amount that the largest and smallest readings vary from each other. If the minimum value is x and the maximum is y, the word “range” is commonly used to refer either to the ordered pair (x,y) or to the difference y−x.
More information is given by the quartiles. The first quartile is the value such that one-quarter of the readings are smaller than it and three-quarters are greater.
To be more precise, if there are 2n or 2n + 1 readings, the first quartile (or lower quartile) is the median of the set of the n smallest readings. The third quartile (or upper quartile) is the median of the set of the n largest readings. As an example, if there are nine readings, {1,2,3,3,3,5,5,7,9}, then the median is the fifth reading, 3. To find the first quartile, look at the set of readings preceding the median, namely, {1,2,3,3}, and take its median; there are four readings, so we take the average of the second and third readings, namely 2.5. And the third quartile is 5+7/2 = 6.
The five-figure summary of a distribution is a list of five numbers—the lowest value, the first quartile, the median, the third quartile, and the highest value. The five-figure summary combines the median, the range and the quartiles. The five-figure summary of the set of readings discussed in the previous paragraph,
{1,2,3,3,3,5,5,7,9},
is
1,2.5,3,6,9.
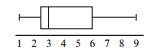
A common way to display the five-figure summary of a distribution is the boxplot. This is a diagram drawn next to a scale with the values of the scores in the distribution. It consists of a box—a rectangle with one end on the lower quartile value and the other end—with tails from the box to the minimum and maximum values, and a bar at the median. For example, the boxplot for the five-figure summary 1,2.5,3,6,9, discussed above, is
It is possible that two of the numbers in a five-number summary could be equal.
If the median equals one of the quartiles, this can be shown in the boxplot by thickening the corresponding vertical line; for example, the five-figure summary 1,3,3,6,9 could be represented as
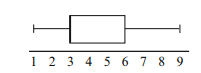
Sample Problem 1.1 Find the five-figure summary of 1,1,3,4,4,7,7,8,8,11, 11,13,14 and represent it in a boxplot.
Solution. The summary is 1,3.5,7,11,14. The boxplot is

Another, more technical, measure of spread is the standard deviation. To define this, we first define the squared deviation of any reading to be the square of its difference from the mean. The variance of a set is the average squared deviation— add all the squared deviations and divide by the order of the population. The standard deviation is the square root of the variance. The standard notation for a standard deviation is σ, the Greek equivalent of s.
Sample Problem 1.2 Find the variance and standard deviation of the population
{1,1,3,3,3,4,4,5}.
Solution. The sum is 24, the order is n = 8, so the mean is 24/8 = 3. We now calculate

The variance or average squared deviation is 14/8 = 1.75. So the standard deviation is
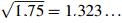
or approximately 1.23.
|
|
|
|
كيف تساهم الأطعمة فائقة المعالجة في تفاقم مرض يصيب الأمعاء؟
|
|
|
|
|
|
|
مشروع ضخم لإنتاج الهيدروجين الأخضر يواجه تأخيرًا جديدًا
|
|
|
|
|
|
|
المجمع العلمي يختتم دورته القرآنية في فن الصوت والنغم بالطريقة المصرية
|
|
|