آخر المواضيع المضافة

 النبات
الحيوان
الأحياء المجهرية
علم الأمراض
التقانة الإحيائية
التقنية الحيوية المكروبية
التقنية الحياتية النانوية
علم الأجنة
الأحياء الجزيئي
علم وظائف الأعضاء
الغدد
المضادات الحيوية
النبات
الحيوان
الأحياء المجهرية
علم الأمراض
التقانة الإحيائية
التقنية الحيوية المكروبية
التقنية الحياتية النانوية
علم الأجنة
الأحياء الجزيئي
علم وظائف الأعضاء
الغدد
المضادات الحيوية| Analytical Ultracentrifugation |


|
|
Read More
Date: 17-3-2021
Date: 9-5-2021
Date: 9-12-2015
|
Analytical Ultracentrifugation
Analytical ultracentrifugation experiments fall into two different categories, termed sedimentation velocity and sedimentation equilibrium. However, they are often employed sequentially on a given macromolecule under analysis (Fig. 1), and they yield related, complementary information about the solution behavior of a macromolecule that is of great interest for a variety reasons. The need may be simple, for example, to determine whether a macromolecule aggregates when prepared or stored in various ways, e.g., refrigerated, frozen, or lyophilized. On a much more complex level and much more important in the context of modern protein biochemistry and molecular biology is to detect and measure the interactions of macromolecules with themselves or with other molecules and to relate this to their functional roles. For these studies, the precise analysis of their behavior in solution is necessary. Finally, analytical ultracentrifugation plays an important role in medicine and industry. It is the reference method for analyzing the concentration-dependent solution behavior of recombinant proteins and other macromolecules employed in pharmaceutical/pharmacological research and in structure-based drug design (1).
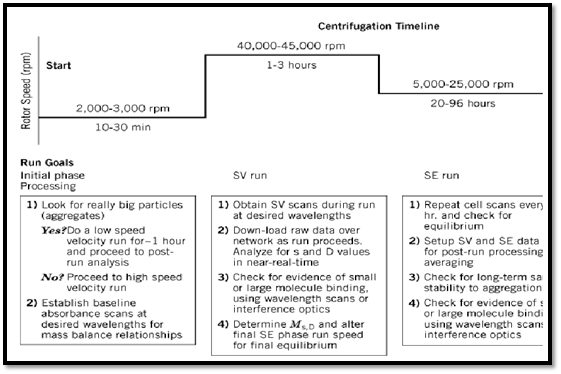
Figure 1. Typical execution scheme for sedimentation velocity (SV) and sedimentation equilibrium (SE) runs.
Analytical ultracentrifugation differs from preparative centrifugation in several important respects. First and foremost as the name implies, it is an analytical technique. If carefully applied, it can give hydrodynamic information that is precise, accurate, and unobtainable by any other single method. The hydrodynamic parameters (molecular weights and sedimentation coefficients) obtained from analytical ultracentrifugation are absolute measurements because the technique is an absolute physical method in the strictest sense. It measures either the intensive or extensive physical properties of solutes directly and requires only knowledge of the rotational rate of the centrifuge rotor, the sample temperature, and the solution density and viscosity (which are extensive properties of the solute–solvent system).
Similarly, calculations of molecular properties from ultracentrifugation data are based on direct, first-principle analyses of solute behavior in solution. Unlike indirect methods, such as static light-scattering, the calculations in analyzing data from the analytical ultracentrifuge do not rely on comparison to a known standard. For example, in static light scattering the scattering behavior of a low molecular weight organic molecule (toluene, for example) is required to calibrate the instrument. Dynamic light scattering provides absolute diffusion coefficients, but the molecular weights estimated from the diffusion coefficients are indirect and depend upon the solution density, viscosity, etc. and on assumptions about molecular dimensions.
Another major difference between preparative centrifugation and analytical ultracentrifugation is that the latter is usually applied to highly purified solute samples. Although samples must be pure, analytical analyses usually require only small amounts of sample material, in the range of 10 to 1000 µg per sample. Finally, although analytical ultracentrifugation is inherently a nondestructive technique, it is not routine to recover or reuse samples that have been analyzed because analytical ultracentrifuge cells and rotors (Figs. 2 and 3), especially those that are most useful for analyzing numerous samples, are not designed for facile sample recovery. Although analytical ultracentrifugation was at one time a useful tool for evaluating the purity of certain biological macromolecules, its use as a simple tool for purity analysis has been superseded by a variety of other bioanalytical techniques. For example, inexpensive SDS-PAGE is routinely the technique of choice for analyzing protein purity during a protein separation protocol and for estimating the molecular weights of polypeptide chains present.
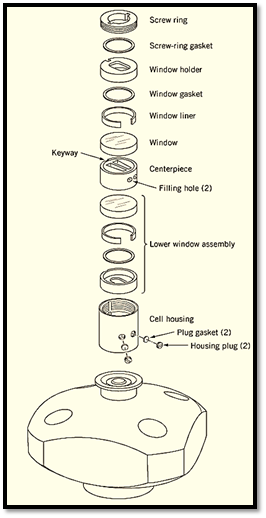
Figure 2. A four-hole analytical ultracentrifuge rotor and a vertically exploded view of the cell assembly with a double-sector, long-channel centerpiece. Sample and reference solutions for analysis (~400 to 500 µl) are introduced into the sealed centerpiece with an appropriate syringe system. Then the cell is placed in the rotor and subjected to centrifugation. Depending upon the analyses performed, it is possible after centrifugation to recover a portion of the sample using the same syringe system (figure courtesy of Beckman Instruments, by permission).
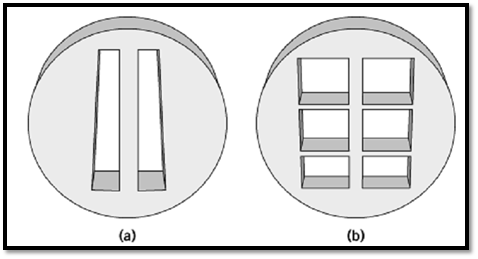
Figure 3. Illustrations of centerpieces used in analytical ultracentrifugation. Left, a long-column, double-sector centerpiece used for sedimentation velocity and equilibrium studies that require large data sets. Right, the multichannel centerpiece (or “Yphantis” centerpiece after its inventor, Dr. David Yphantis) used primarily for sedimentation equilibrium studies where analysis of a larger number of samples is desired.
The present (and likely future) value of analytical ultracentrifugation lies in its unmatched ability to provide direct information in two primary areas: (1) the extent to which an otherwise chemically pure sample of a macromolecular solute exhibits monodispersity or polydispersity and (2) the extent to which different chemically pure molecules interact. Because these two questions are fundamental to all areas of modern cellular and molecular biology and biochemistry, analytical ultracentrifugation remains a unique and extremely powerful biophysical tool.
1. The Modern Analytical Ultracentrifuge
The technique requires only small sample volumes, ~20 µl to ~500 µl depending upon the type of centerpiece employed (Figs. 2 and 3). A computer-controlled optical system detects the exact extent and position of the radial displacement of solute molecules at various times during the centrifugation run. Optical detection is accomplished by directly measuring the concentration of the solute as a function of radial position in the sample cell, either by its absorbance or by the change in refractive index, using Rayleigh interference optics. Like dual-beam optical spectroscopy, the technique is also differential in that it employs a sample solution to be measured and a reference solution used to “blank out” or “subtract” a signal background. The only modern, commercially available analytical ultracentrifuges are the XLA/XLI models manufactured by Beckman Instruments, which operate at speeds ranging from ~2,000 to ~50,000 rpm . The precise speed or speed range of operation for an experiment is determined by the type of measurement(s(to be made and depends on the size of the molecules being studied and on the type of sample cell centerpieces, centrifuge rotor, and the data collection system used.
The XLA/XLI analytical ultracentrifuges offer either absorbance-based optical detection (XLA, Fig. 4) or both absorbance and interference-based optical detection (XLI, Fig. 5). In addition to measuring the molecular weights and sedimentation coefficients of individual molecules, their distributions in samples can also be measured. The analytical ultracentrifuge can also be also used for direct determination of ligand-binding constants and stoichiometries. Further, when combined with other physical measurements, these instruments are useful for determining the diffusion coefficients and molecular shapes of macromolecules. Thus, changes in shape related to ligand binding or solvent perturbations can also be evaluated.
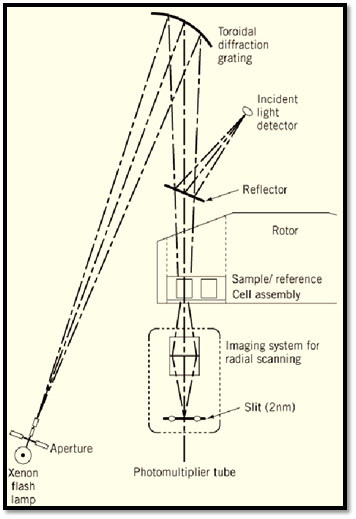
Figure 4. Absorbance-based optical system of the XLA analytical ultracentrifuge from Beckman Instruments. Light from a high intensity flash lamp passes along an optical tube to a computer-controlled toroidal diffraction grating, which selects the wavelength(s) of observation. Light at the selected wavelength, within the range ~200–800 nm , is focused on the sample cell in the rotor. Light passing through the sample is recorded by the radially tracking photomultiplier. Then the data are analyzed using specialized software on an associated computer (figure courtesy of Beckman Instruments, by permission).

Figure 5. Interference and/or absorbance-based optical system of the XLI ultracentrifuge from Beckman Instruments. The absorbance-based optical system is outlined in Fig. 4. For interference measurements, a laser light source is attached to the absorbance optical tower, and an additional optical path and detector system is employed (lower right quadrant of figure). The interference system uses Rayleigh interference optics and a computer-controlled CCD camera detection system. Data are analyzed using specialized software on an associated computer. Using an eight-hole centrifuge rotor and centerpieces that hold three sample and reference solutions each, it is possible to analyze 21 samples in a single ultracentrifuge run (figure courtesy of Beckman Instruments, by permission).
1.1. Choosing an Optical System for Measurements
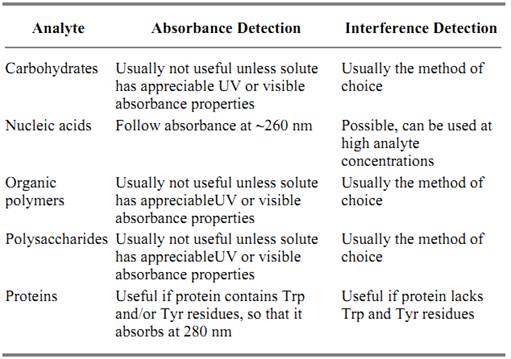
Although it is often useful to employ both absorbance and optical interference measurements when examining a sample, some considerations make one type of measurement preferable to the other. The possible choices for various types of samples are outlined in Table 1. In addition to the general preferences for detecting various analytes, other important factors influence the choice of detection methods. The relative sensitivities and dynamic ranges of absorbance versus interference detection can be a consideration. The typical useful range for absorbance measurements in a sedimentation equilibrium centrifugation experiment for an “average” protein with an absorbance at 280 nm of ) 1.0 mg/ml)–1(cm)–1 is in the range of ~10 µg/ml to ~4 mg/ml , when the measurements employ centerpieces with both standard (12 mm) and reduced (3 mm) path lengths. In sedimentation velocity experiments using absorbance detection at 280 nm, the practical low end of the concentration range is about 50 to 100 µg/ml. Sensitivity for proteins can be increased by using light with wavelengths in the range of 215 to 240 nm, where the protein peptide backbone absorbs and the absorbance of a protein is typically 3- to 10-fold greater, although this is technically more demanding. Alternatively, the protein may have a natural cofactor chromophore with a large extinction coefficient, or chemical modification can be used to introduce such a chromophore. Optical interference measurements have roughly the same absolute dynamic range as absorbance measurements, but they are routinely more useful in the mid-to-high concentration range, i.e., ~0.1 to ~10 mg/ml .
Table 1. General Preferences in Analytical Ultracentrifugation for Detecting Different Analytes
The selectivity of the detection technique can also be a factor in performing an experiment. The use of this approach is illustrated in Fig. 6 for examining the potential for interactions between the Alzheimer's disease beta-amyloid peptide and the serum C1Q component of the complement system, which other studies had suggested is a trigger for activating the complement cascade and for potential neuronal cell loss. In this work, a 5-kDa peptide was labeled with the chromophore fluorescein. Binding of the labeled peptide to a ~150 kDa antifluorescein antibody was used as a positive control to examine the potential for b-amyloid peptide to bind to C1q. The labeled peptide binds to the antibody as expected, but it does not bind to C1q.

Figure 6. Binding of a xanthene-labeled Alzheimer's b-amyloid peptide to an antifluorescein antibody but not to serum complement C1q, as analyzed at sedimentation equilibrium at low speed (5000 rpm). The fluorescein analog, xanthene, absorbs light at 510 nm (solid line), and the proteins absorb light at 280 nm (dotted line). Panel (a) shows the radial distributions of labeled peptide alone at 280 and 510 nm (no sedimentation). Panel (b) shows the labeled peptide sedimented in the presence of C1q, C1q tended to sediment, but the peptide did not. Panel (c) shows the control experiment where the labeled peptide was sedimented in the presence of an anti fluorescein antibody. The peptide binds to the antibody and sediments with a molecular weight equivalent to that of the antibody. These results demonstrate that the monomeric form of the amyloid peptide implicated in Alzheimer's disease is unlikely to bind to complement C1q and thus induce complement-mediated neural cell death (from Ref. 8, with permission).
In analytical ultracentrifugation, another important consideration is sample and reference solution buffer matching. If the solutions are poorly matched, the resulting data are usually poor, even with the extensive signal averaging employed with advanced detectors and software.
Interference detection measurements are based on the change in the refractive index of the solution caused by a solute, which is a function of its concentration. For these measurements, the system records the differential change in the refractive index of the sample versus the reference cell, as a function of radial position. The refractive index of a solution is a function of the mass of all solutes, not of their absorbance or molarity, and it is not possible to distinguish between different solutes. In fact, buffers and salts routinely contribute most of the change in refractive index because they are present in much higher concentrations than the protein. Therefore, interference measurements are extremely sensitive to small mismatches in refractive index between the buffers of the sample and reference solutions. As a result, samples analyzed by interference measurements routinely require exhaustive dialysis. With appropriate sample/reference solution preparation, it is possible to achieve protein concentrations of >100 mg/ml routinely. The only effective upper limit is the intrinsic solubility of the protein itself under the conditions of analysis (rotor velocity, temperature, pH, etc., which can be easily changed). For both absorbance and interference measurements, the lower limit on size is a molecular weight of ~200 Da, and the upper limit is effectively about 30 × 106 Da.
Absorbance optics permit the differential absorbance of two molecules to be employed to distinguish their sedimentation properties (as in Fig. 6). This is not possible with interference optics, however, so it is not possible to distinguish between two different solute molecules with similar masses.
Another feature of interference measurements is their use in a differential mode. Because the interference optical system is double-beam, differential centrifugation experiments can be performed where the protein is present in both cells and a small ligand only in one. Consequently, the signal from the protein is blanked out, leaving only the signal from the ligand. A ligand that binds to the protein (even weakly) is displaced along the radial axis of centrifugal force in the centrifuge cell. Because the protein signal is blanked out, the only change in refractive index observed along the radial (force) axis is caused by the change in radial distribution of the ligand (2, 3 )
Absorbance measurements generally have less stringent referencing requirements. In practice it is necessary only that the reference buffer has an absorbance at the wavelength of analysis at which it is electronically possible for the instrument to perform the desired subtraction. Therefore, absorbance measurements are relatively more forgiving for buffer matching in sample/reference preparation. They are not without other intrinsic problems, however, in particular those related to the absorbance of buffers and solute extinction coefficients. Most biologically useful buffers and common solution additives have some characteristic absorbance in the wavelengths used to analyze proteins in solution. Because of the high total sample/reference solution absorbance, it may be difficult or impossible to make the requisite difference absorbance measurements. However, under these conditions protein samples that have been carefully prepared by dialysis but are optically opaque at UV wavelengths, may be routinely analyzed by interference rather than absorbance detection (as above). Finally, one interesting drawback to absorbance measurements,which is routinely neglected in sedimentation equilibrium analyses (in particular), is that the analyte solution extinction coefficient(s) may vary with the composition of the solution, so that its absorbance can change during a centrifugation run. Homo- or heteroassociation processes may alter the protein extinction coefficients, which contributes nonlinear perturbations to the total absorbance. Thus careful analyses require that the radial distributions of molecules undergoing such associations be measured at several wavelengths. Interference measurements, in comparison, are insensitive to these alterations in solute extinction coefficient.
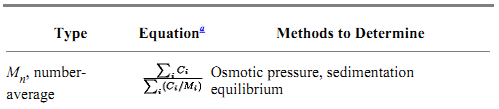
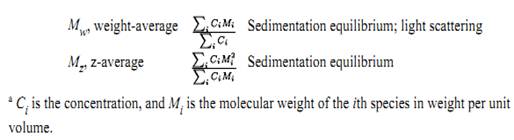
1.2. Monodispersity, Polydispersity, Paucidispersity, and Nonideality A solute is said to be monodisperse if it exhibits behavior characteristic of a single species in solution. If the solute undergoes indefinite self-association under the solution conditions examined, it is said to exhibit polydispersity. If a sample of solute molecules is composed of a mixture of a limited number of species with different chemical compositions, its solution behavior is polydisperse, for example, with respect to its molecular weight distribution, but the sample is termed paucidisperse. The differences between various types of solute behavior in solution are outlined in Table 2. It is often useful to define molecular weight distributions in terms of the molecular weight averages Mn, Mw, and Mz, which are the number-, weight-, and z-averages, respectively (Table 3). They are valuable for estimating sample homogeneity. A pure solute gives identical values of Mn, Mw, and Mz. Different methods of measurement give different averages.
Table 2. Summary of Types of Solute Hydrodynamic Behavior
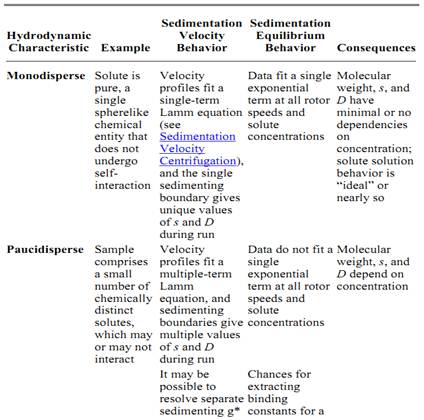
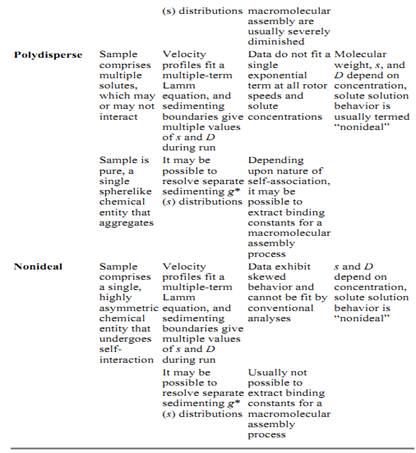
Table 3. Molecular Weight Averages
Nonideality is typically observed at high concentrations of a solute and is caused by the effects of excluded volume (versus actual molecular volume) on solute hydrodynamic behavior. The effects of nonideality are small for spherical molecules, because their excluded and actual volumes are essentially equivalent. With such molecules, their hydrodynamic behavior varies in direct proportion to the size of the molecular sphere. When molecules are rodlike, nonideality becomes more pronounced. As the concentration increases, the effect is nonlinear and it is significantly worse at greater ratios of molecular length to width. Intermolecular interactions are another cause of nonideality. For example, electrostatic charge–charge repulsion can be significant at high solute concentrations and low solution ionic strengths. Experimentally, such charge–charge effects are usually reduced by increasing the solution ionic strength. The role of nonideality in sample behavior is identified by performing a series of studies at different solute concentrations and extrapolating the measured hydrodynamic parameters to infinite dilution. 1.3. Other Physical Measurements Necessary to Analyze Ultracentrifuge Data Calculating results from sedimentation equilibrium and velocity experiments requires several additional physical measurements of the solute and of the solutions employed. To calculate the anhydrous weight-average molecular weight, the density of the solvent and the partial specific volume of the solute must be known.
There are typically two ways to obtain these values. They can be measured with an ultrasonic density meter or pyncnometer or estimated from various tables if the specific buffer and solute chemical compositions are known. For a protein, the approximate partial specific volume is calculated from its amino acid composition (4, 5). The density of a buffer of exact composition can be estimated from an appropriate reference table (for example, from the CRC Handbook of Chemistry and Physics). Of the two direct methods for determining solvent densities and solute partial specific volumes, ultrasonic densitometry is preferred because it requires less solute for measurements. It is good experimental practice to measure both the solvent density and the partial specific volume of a solute sample of interest. In the case of proteins, this is particularly true if the studies analyze the tendencies of the proteins to undergo association or conformational changes when bound to a ligand. Such interactions are often accompanied by significant changes in the volume of the protein that are unaccounted for if the specific volumes of the individual amino acids comprising the protein are used in the calculation (6, 7). Additionally, if the protein contains carbohydrate (a glycoprotein, for example) or bound lipid (a lipoprotein), estimates from reference tables can, at best, be charitably characterized as a guess.
The final physical measurement necessary is the measurement of the solution viscosity . This value can be estimated from tables (5) (as for buffer density), but again it is good experimental practice to measure the solution viscosity directly with a simple, commercially available viscometer.
References
1. S. W. Snyder, R. P. Edalji, F. G. Lindh, K. A. Walter, L. Solomon, S. Pratt, K. Steffy, and T. F. Holzman (1996) J. Protein Chem. 15, 763–774. 2. I. Z. Steinberg and H. K. Schachman (1966) Biochemistry 12, 3728–3747.
3. T. M. Lohman, C. G. Wensley, J. Cina, J. R. R. Burgess, and M. T. Record (1980( Biochemistry 19, 3516–3522.
4. E. J. Cohn and J. T. Edsall (1943) In Proteins, Amino Acids, and Peptides as Ions and Dipolar Ions (ACS Monograph series), Reinhold Publishing, New York, pp. 155–176.
5. H. Durchschlag (1986) In Thermodynamic Data for Biochemistry and Biotechnology (H. J. Hinz, ed.), Springer-Verlag, New York, pp. 45–128.
6. H. Durchschlag and R. Jaenicke (1982) Int. J. Biol. Macromol. 5, 143–148.
7. H. Durchschlag and R. Jaenicke (1982) Biochem. Biophys. Res. Commun. 108, 1074–1079.
8. S. W. Snyder, G. T. Wang, L. Barrett, U. S. Ladror, D. Casuto, C. M. Lee, G. A. Krafft, R. B. Holzman, and T. F. Holzman (1994) Exp. Neurol. 128, 136–142.


|
|
|
|
اكتشاف تأثير صحي مزدوج لتلوث الهواء على البالغين في منتصف العمر
|
|
|
|
|
|
|
زهور برية شائعة لتر ميم الأعصاب التالفة
|
|
|
|
|
|
العتبة العباسية تطلق مسابقة فن التصوير الفوتوغرافي الثانية للهواة ضمن فعاليات أسبوع الإمامة الدولي
|
|
|
|
لجنة البرامج المركزيّة تختتم فعاليّات الأسبوع الرابع من البرنامج المركزي لمنتسبي العتبة العباسيّة
|
|
|
|
قسم المعارف: عمل مستمر في تحقيق مجموعة من المخطوطات ستسهم بإثراء المكتبة الدينية
|
|
|
|
متحف الكفيل يشارك في المؤتمر الدولي الثالث لكلية الآثار بجامعة الكوفة
|