0
settings
الوضع الليلي
moon
انماط الصفحة الرئيسية arrow
EN
1
المرجع الالكتروني للمعلوماتية

علم الكيمياء

تاريخ الكيمياء والعلماء المشاهير

التحاضير والتجارب الكيميائية

المخاطر والوقاية في الكيمياء

اخرى

مقالات متنوعة في علم الكيمياء

كيمياء عامة

الكيمياء التحليلية

مواضيع عامة في الكيمياء التحليلية

التحليل النوعي والكمي

التحليل الآلي (الطيفي)

طرق الفصل والتنقية

الكيمياء الحياتية

مواضيع عامة في الكيمياء الحياتية

الكاربوهيدرات

الاحماض الامينية والبروتينات

الانزيمات

الدهون

الاحماض النووية

الفيتامينات والمرافقات الانزيمية

الهرمونات

الكيمياء العضوية

مواضيع عامة في الكيمياء العضوية

الهايدروكاربونات

المركبات الوسطية وميكانيكيات التفاعلات العضوية

التشخيص العضوي

تجارب وتفاعلات في الكيمياء العضوية

الكيمياء الفيزيائية

مواضيع عامة في الكيمياء الفيزيائية

الكيمياء الحرارية

حركية التفاعلات الكيميائية

الكيمياء الكهربائية

الكيمياء اللاعضوية

مواضيع عامة في الكيمياء اللاعضوية

الجدول الدوري وخواص العناصر

نظريات التآصر الكيميائي

كيمياء العناصر الانتقالية ومركباتها المعقدة

مواضيع اخرى في الكيمياء

كيمياء النانو

الكيمياء السريرية

الكيمياء الطبية والدوائية

كيمياء الاغذية والنواتج الطبيعية

الكيمياء الجنائية

الكيمياء الصناعية

البترو كيمياويات

الكيمياء الخضراء

كيمياء البيئة

كيمياء البوليمرات

مواضيع عامة في الكيمياء الصناعية

الكيمياء التناسقية

الكيمياء الاشعاعية والنووية

الكيمياء الجنائية

أساسيات كيمياء الأدلة الجنائية

الأدلة الجنائية

تحليل المخدرات

تحليل السموم

البصمة الكيميائية

قم بتسجيل الدخول اولاً لكي يتسنى لك الاعجاب والتعليق.

Evaluating column performance , Separation factor

المؤلف:  Sue Jickells , Adam Negrusz (Editors)

المصدر:  Clarkes Analytical Forensic Toxicology

الجزء والصفحة:  p482-483

2026-11-22

43

+

-

20

Evaluating column performance

Separation factor

The separation factor (a) is a measure of the time interval between two peaks. If α equals 1, then the peaks have the same retention time and co elute. Separation factor is calculated using the equation:

where k1 is the retention factor of the first peak, and k2 the retention factor for the second peak.

The value of α, however, does not indicate whether the peaks are resolved completely from one another. Two peaks may have only 0.01 min between them on one column but still be resolved completely, while on another column they may have 0.1 min between them but not be resolved adequately (refer to Fig. 1).
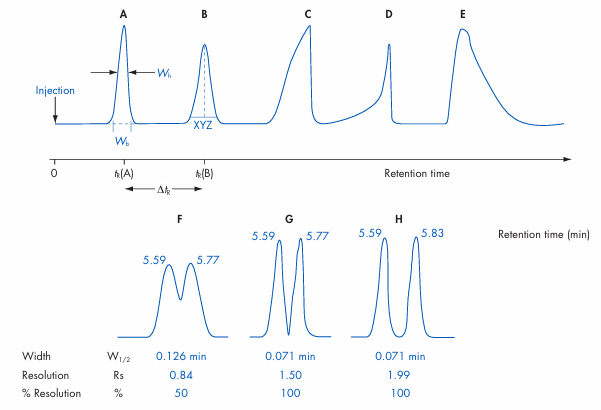
Figure 1 A and B are symmetrical peaks that show the measurement of significant parameters. Wb, width at the base of the peak; Wh, width at half peak height; tR (A) and tR (B), retention times of peaks A and B, respectively; DtR, the difference in retention time between A and B; XYZ, a line drawn at 10% of peak height. Peak C is symptomatic of column overload with solute. Peak D is symptomatic of degradation of a thermally unstable solute. Peak E is symptomatic of adherence to active sites in the injection port or on the column.

Resolution of two compounds: In F and G the peaks of the two compounds have identical retention times (5.59 and 5.77 min, respectively), but in G the peaks are narrower (Wh 0.071 versus 0.126 min, respectively), and are fully resolved (Rs 1.50 versus 0.84, respectively). In H the peak widths of the two compounds are the same as in G, but the retention time of peak B is later (5.83 versus 5.77 min, respectively). Again, the peaks are fully resolved and Rs is larger than in G (Rs = 1.99 versus 1.50).


اخر الاخبار

اشترك بقناتنا على التلجرام ليصلك كل ما هو جديد