Infrared Spectroscopy
 المؤلف:
William Reusch
 المصدر:
Virtual Textbook of Organic Chemistry
 الجزء والصفحة:
............
 11-8-2018
 2480
2480
Infrared Spectroscopy
As noted in a previous chapter, the light our eyes see is but a small part of a broad spectrum of electromagnetic radiation. On the immediate high energy side of the visible spectrum lies the ultraviolet, and on the low energy side is the infrared. The portion of the infrared region most useful for analysis of organic compounds is not immediately adjacent to the visible spectrum, but is that having a wavelength range from 2,500 to 16,000 nm, with a corresponding frequency range from 1.9*1013 to 1.2*1014 Hz.

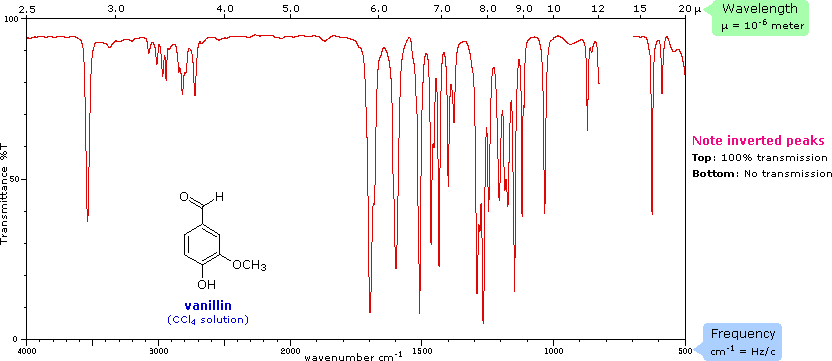
Photon energies associated with this part of the infrared (from 1 to 15 kcal/mole) are not large enough to excite electrons, but may induce vibrational excitation of covalently bonded atoms and groups. The covalent bonds in molecules are not rigid sticks or rods, such as found in molecular model kits, but are more like stiff springs that can be stretched and bent. The mobile nature of organic molecules was noted in the chapter concerning conformational isomers. We must now recognize that, in addition to the facile rotation of groups about single bonds, molecules experience a wide variety of vibrational motions, characteristic of their component atoms. Consequently, virtually all organic compounds will absorb infrared radiation that corresponds in energy to these vibrations. Infrared spectrometers, similar in principle to the UV-Visible spectrometer described elsewhere, permit chemists to obtain absorption spectra of compounds that are a unique reflection of their molecular structure. An example of such a spectrum is that of the flavoring agent vanillin, shown below.

The complexity of this spectrum is typical of most infrared spectra, and illustrates their use in identifying substances. The gap in the spectrum between 700 & 800 cm-1 is due to solvent (CCl4) absorption. Further analysis (below) will show that this spectrum also indicates the presence of an aldehyde function, a phenolic hydroxyl and a substituted benzene ring. The inverted display of absorption, compared with UV-Visible spectra, is characteristic. Thus a sample that did not absorb at all would record a horizontal line at 100% transmittance (top of the chart).
The reciprocal centimeter is the number of wave cycles in one centimeter; whereas, frequency in cycles per second or Hz is equal to the number of wave cycles in 3*1010 cm (the distance covered by light in one second). Wavelength units are in micrometers, microns (μ), instead of nanometers for the same reason. Most infrared spectra are displayed on a linear frequency scale, as shown here, but in some older texts a linear wavelength scale is used. A calculator for interconverting these frequency and wavelength values is provided on the right. Simply enter the value to be converted in the appropriate box, press "Calculate" and the equivalent number will appear in the empty box.
Infrared spectra may be obtained from samples in all phases (liquid, solid and gaseous). Liquids are usually examined as a thin film sandwiched between two polished salt plates (note that glass absorbs infrared radiation, whereas NaCl is transparent). If solvents are used to dissolve solids, care must be taken to avoid obscuring important spectral regions by solvent absorption. Perchlorinated solvents such as carbon tetrachloride, chloroform and tetrachloroethene are commonly used. Alternatively, solids may either be incorporated in a thin KBr disk, prepared under high pressure, or mixed with a little non-volatile liquid and ground to a paste (or mull) that is smeared between salt plates.
 الاكثر قراءة في التشخيص العضوي
 اخر الاخبار
اخبار العتبة العباسية المقدسة


