UV-Visible Spectroscopy
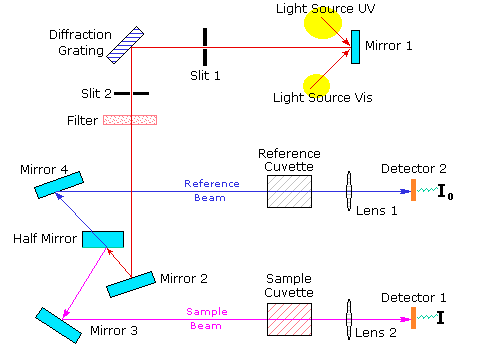
A diagram of the components of a typical spectrometer are shown in the following diagram. The functioning of this instrument is relatively straightforward. A beam of light from a visible and/or UV light source (colored red) is separated into its component wavelengths by a prism or diffraction grating. Each monochromatic (single wavelength) beam in turn is split into two equal intensity beams by a half-mirrored device. One beam, the sample beam (colored magenta), passes through a small transparent container (cuvette) containing a solution of the compound being studied in a transparent solvent. The other beam, the reference (colored blue), passes through an identical cuvette containing only the solvent. The intensities of these light beams are then measured by electronic detectors and compared. The intensity of the reference beam, which should have suffered little or no light absorption, is defined as I0. The intensity of the sample beam is defined as I. Over a short period of time, the spectrometer automatically scans all the component wavelengths in the manner described. The ultraviolet (UV) region scanned is normally from 200 to 400 nm, and the visible portion is from 400 to 800 nm.
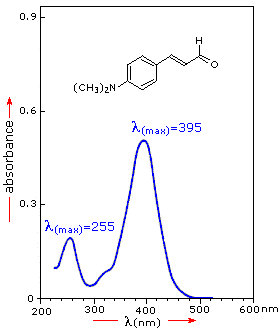
If the sample compound does not absorb light of of a given wavelength, I = I0. However, if the sample compound absorbs light then I is less than I0, and this difference may be plotted on a graph versus wavelength, as shown on the right. Absorption may be presented as transmittance (T = I/I0) or absorbance (A= log I0/I). If no absorption has occurred, T = 1.0 and A= 0. Most spectrometers display absorbance on the vertical axis, and the commonly observed range is from 0 (100% transmittance) to 2 (1% transmittance). The wavelength of maximum absorbance is a characteristic value, designated as λmax.
Different compounds may have very different absorption maxima and absorbances. Intensely absorbing compounds must be examined in dilute solution, so that significant light energy is received by the detector, and this requires the use of completely transparent (non-absorbing) solvents. The most commonly used solvents are water, ethanol, hexane and cyclohexane. Solvents having double or triple bonds, or heavy atoms (e.g. S, Br & I) are generally avoided. Because the absorbance of a sample will be proportional to its molar concentration in the sample cuvette, a corrected absorption value known as the molar absorptivity is used when comparing the spectra of different compounds. This is defined as:
Molar Absorptivity,ε = A/ c l ( where A= absorbance, c = sample concentration in moles/liter
& l = length of light path through the cuvette in cm)
For the spectrum on the right, a solution of 0.249 mg of the unsaturated aldehyde in 95% ethanol (1.42 • 10-5 M) was placed in a 1 cm cuvette for measurement. Using the above formula, ε = 36,600 for the 395 nm peak, and 14,000 for the 255 nm peak. Note that the absorption extends into the visible region of the spectrum, so it is not surprising that this compound is orange colored.
Molar absorptivities may be very large for strongly absorbing compounds (ε >10,000) and very small if absorption is weak (ε = 10 to 100)


