آخر المواضيع المضافة

 الفيزياء الكلاسيكية
الكهربائية والمغناطيسية
علم البصريات
الفيزياء الحديثة
النظرية النسبية
الفيزياء النووية
فيزياء الحالة الصلبة
الليزر
علم الفلك
المجموعة الشمسية
الطاقة البديلة
الفيزياء والعلوم الأخرى
مواضيع عامة في الفيزياء
الفيزياء الكلاسيكية
الكهربائية والمغناطيسية
علم البصريات
الفيزياء الحديثة
النظرية النسبية
الفيزياء النووية
فيزياء الحالة الصلبة
الليزر
علم الفلك
المجموعة الشمسية
الطاقة البديلة
الفيزياء والعلوم الأخرى
مواضيع عامة في الفيزياء| Chart of the Nuclides |


|
|
Read More
Date: 17-4-2017
Date: 21-4-2017
Date: 11-4-2017
|
Chart of the Nuclides
A tabulated chart called the Chart of the Nuclides lists the stable and unstable nuclides in addition to pertinent information about each one. Figure 1 shows a small portion of a typical chart. This chart plots a box for each individual nuclide, with the number of protons (Z) on the vertical axis and the number of neutrons (N = A - Z) on the horizontal axis.
The completely gray squares indicate stable isotopes. Those in white squares are artificially radioactive, meaning that they are produced by artificial techniques and do not occur naturally. By consulting a complete chart, other types of isotopes can be found, such as naturally occurring radioactive types (but none are found in the region of the chart that is illustrated in Figure 1).
Located in the box on the far left of each horizontal row is general information about the element. The box contains the chemical symbol of the element in addition to the average atomic weight of the naturally occurring substance and the average thermal neutron absorption cross section, which will be discussed in a later module. The known isotopes (elements with the same atomic number Z but different mass number A) of each element are listed to the right.

Figure 1: Nuclide Chart for Atomic Numbers 1 to 6


|
|
|
|
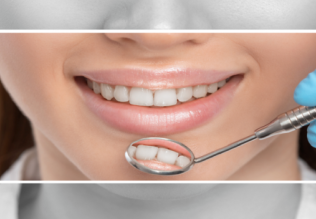
زراعة الأسنان.. بين بريق التجميل وحاجة المريض إليها
|
|
|
|
|
|
|
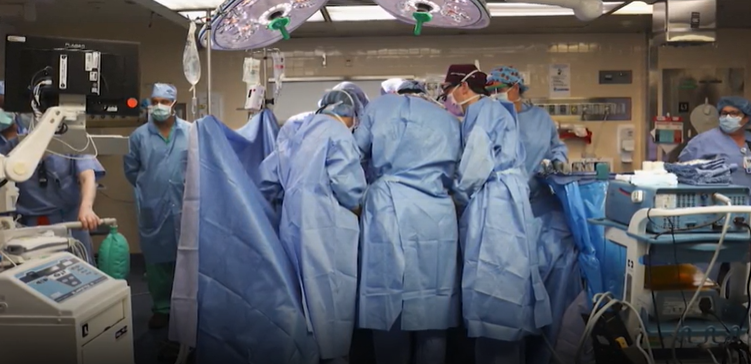
وفاة أول رجل خضع لزراعة كلية خنزير.. والمستشفى يوضح الأسباب
|
|
|
|
|
|
اختتام الأسبوع الثاني من الشهر الثالث للبرنامج المركزي لمنتسبي العتبة العباسية
|
|
|
|
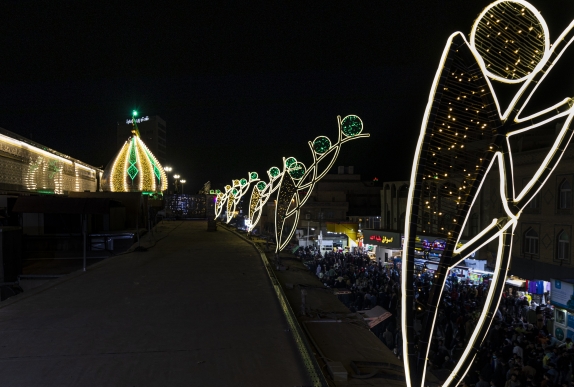
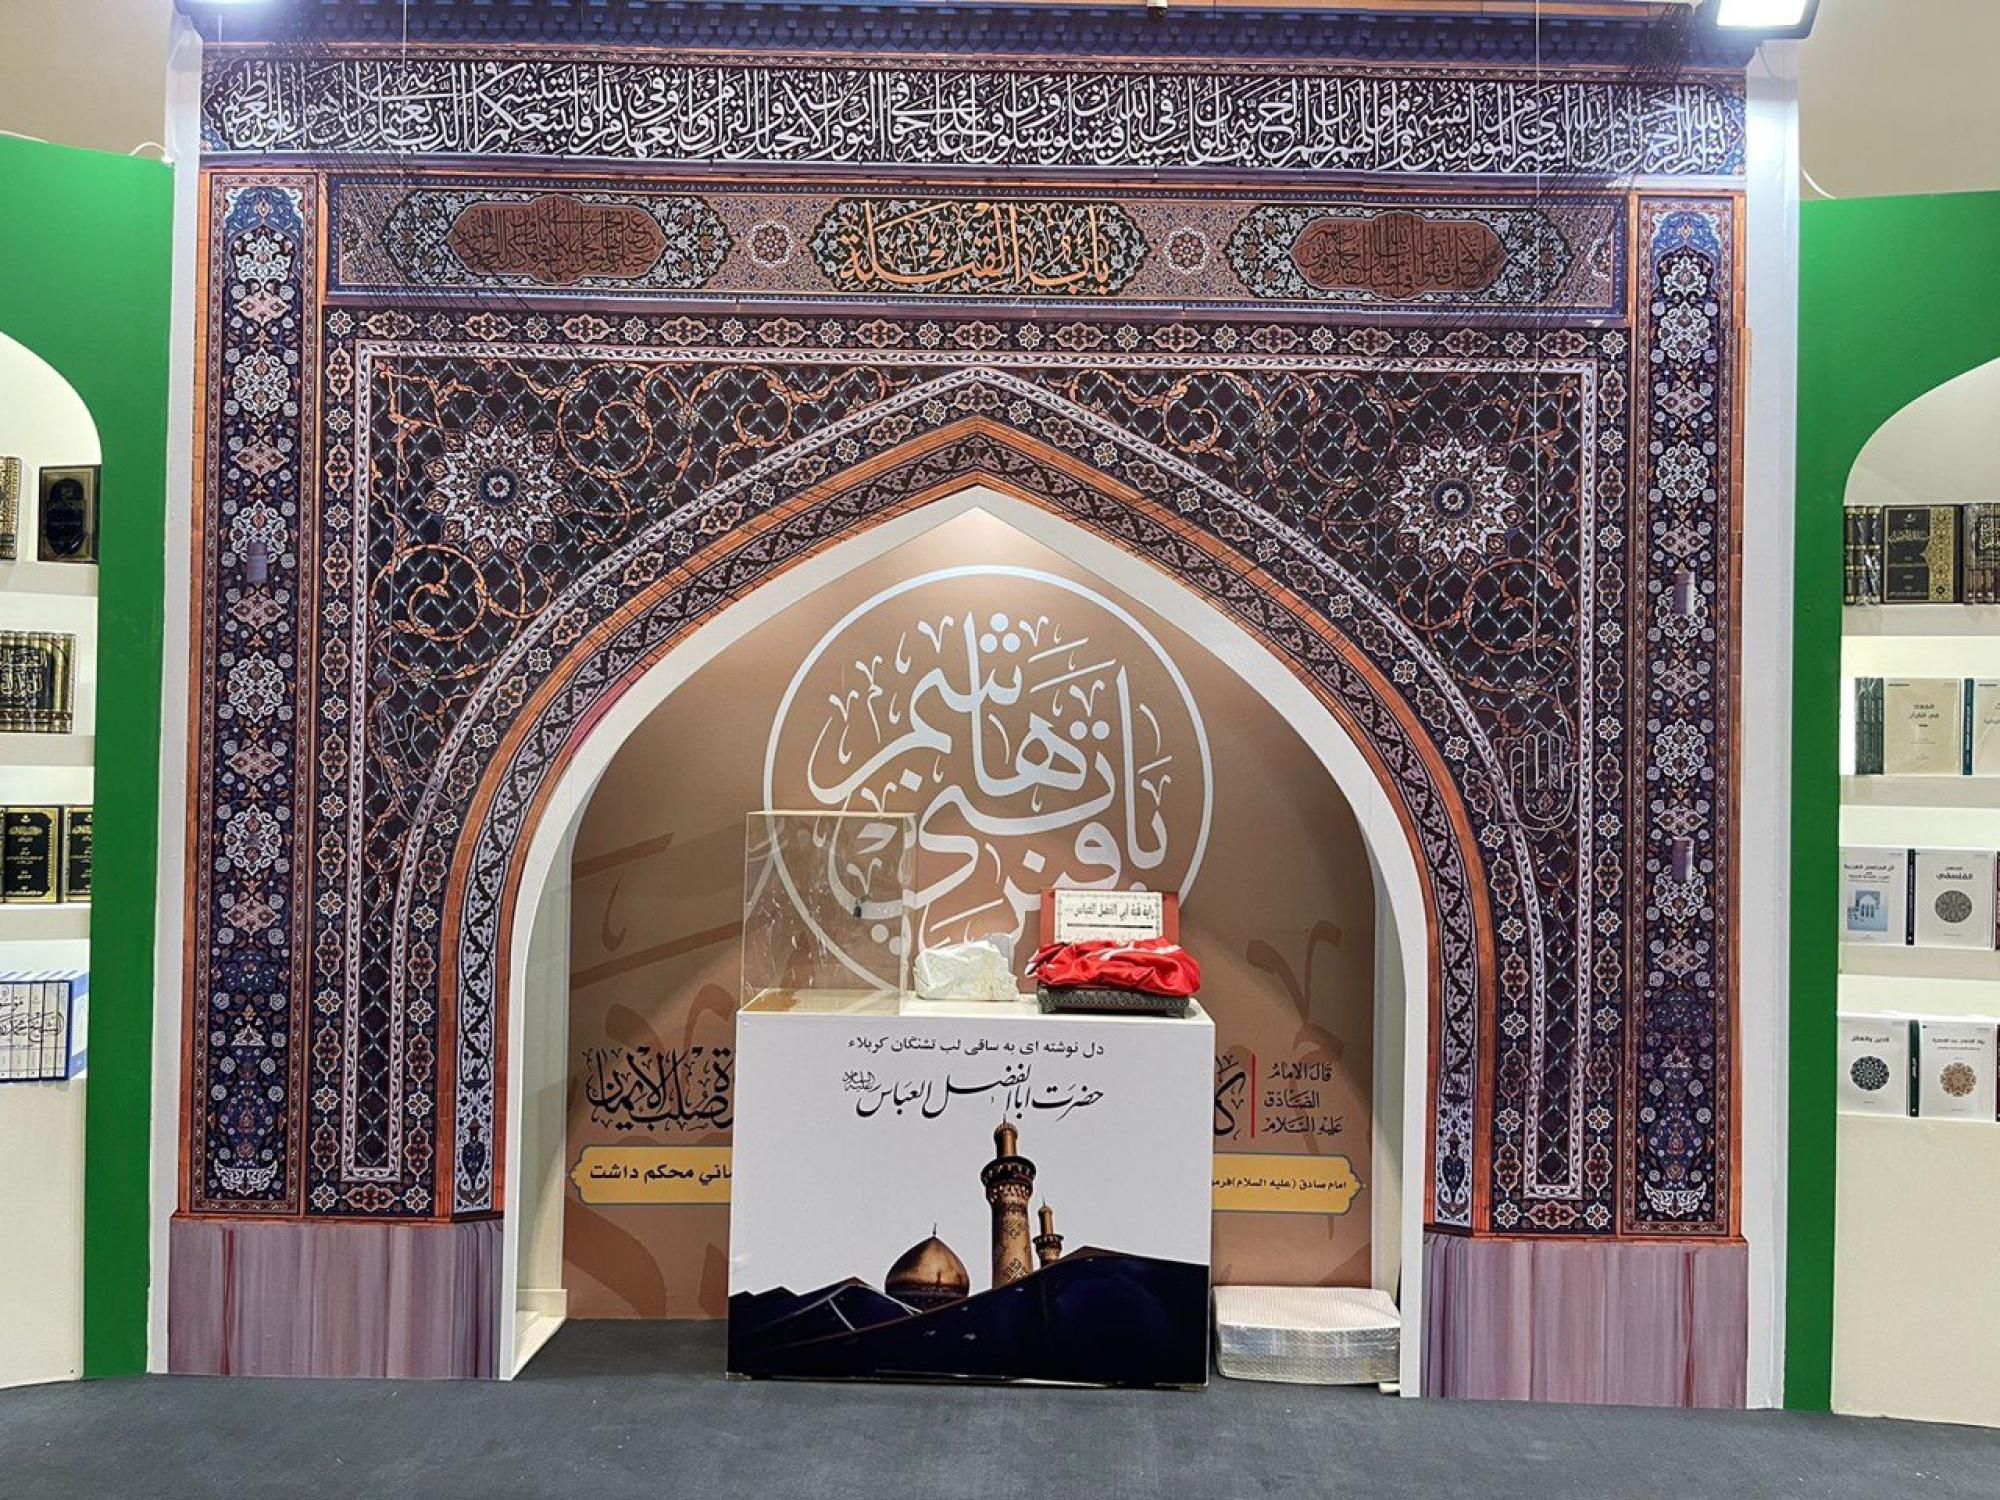
راية قبة مرقد أبي الفضل العباس (عليه السلام) تتوسط جناح العتبة العباسية في معرض طهران
|
|
|
|
جامعة العميد وقسم الشؤون الفكرية يعقدان شراكة علمية حول مجلة (تسليم)
|
|
|
|
قسم الشؤون الفكريّة يفتتح باب التسجيل في دورات المواهب
|