
Tanabe Sugano diagrams
 المؤلف:
Peter Atkins, Tina Overton, Jonathan Rourke, Mark Weller, and Fraser Armstrong
المؤلف:
Peter Atkins, Tina Overton, Jonathan Rourke, Mark Weller, and Fraser Armstrong
 المصدر:
Shriver and Atkins Inorganic Chemistry ,5th E
المصدر:
Shriver and Atkins Inorganic Chemistry ,5th E
 الجزء والصفحة:
ص495-496
الجزء والصفحة:
ص495-496
 2025-09-28
 341
341
Tanabe Sugano diagrams
Key point: Tanabe Sugano diagrams are correlation diagrams that depict the energies of electronic states of complexes as a function of the strength of the ligand field. Diagrams showing the correlation of all terms can be constructed for any electron configuration and strength of ligand field. The most widely used versions are called Tanabe Sugano diagrams, after the scientists who devised them. Figure 20.28 shows the diagram for d2 and we can see splittings for all the atomic terms that split; thus, the 3F splits into three, the 1D into two, and the 1G into four. In these diagrams the term energies, E, are expressed as E/B and plotted against ∆O /B, where B is the Racah parameter. The relative energies of the terms arising from a given configuration are independent of A, and by choosing a value of C (typically setting C ≈ 4B), terms of all energies can be plotted on the same diagrams. Some lines in Tanabe Sugano diagrams are curved because of the mixing of terms of the same symmetry type. Terms of the same symmetry obey the nocrossing rule, which states that, if the increasing ligand field causes two weak-field terms of the same symmetry to approach, then they do not cross but bend apart from each other (Fig. 20.29). The effect of the noncrossing rule can be seen for the two 1E terms, the two 1T2 terms, and the two 1A1 terms in Fig. 20.28.
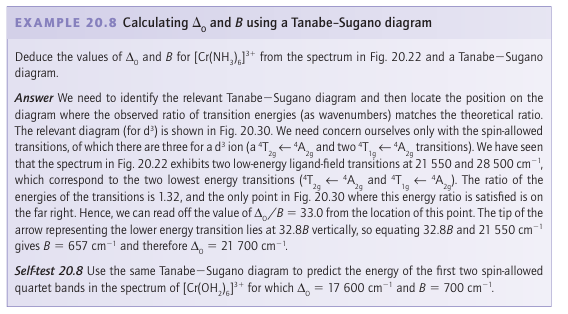
Tanabe Sugano diagrams for Oh complexes with configurations d2 to d8 are given in Resource section 6. The zero of energy in a Tanabe Sugano diagram is always taken as that of the lowest term. Hence the lines in the diagrams have abrupt changes of slope when there is a change in the identity of the ground term brought about by the change from high-spin to low-spin with increasing field strength (see the diagram for d4, for instance). The purpose of the preceding discussion has been to find a way to extract the value of the ligand-field splitting parameter from the electronic absorption spectrum of a complex with more than one d electron, when electron-electron repulsions are important, such as that in Fig. 20.22. The strategy involves fitting the observed transitions to the correlation lines in a Tanabe Sugano diagram and identifying the values of ∆O and B where the ob-served transition energies match the pattern. This procedure is illustrated in Example 20.8. As we shall see in Section 20.6, certain transitions are allowed and certain transitions are forbidden. In particular, those that correspond to a change of spin state are forbidden, whereas those that do not are allowed. In general, spin-allowed transitions will dominate the UV/visible absorption spectrum, thus we might only expect to see three transitions for a d2 ion, specifically 3T2g ← 3T1g, 3T1g ← 3T1g, and 3A2g ← 3T1g. However, some complexes (for instance high-spin d5 ions such as Mn+2) do not have any spin-allowed transitions and none of the 11 possible transitions dominates.
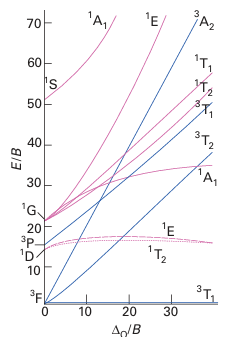
Figure 20.28 The Tanabe Sugano diagram for the d2 configuration. Note that the left-hand axis corresponds to Fig. 20.23 (left). A complete collection of diagrams for dnconfigurations is given in Resource section 6. The parity subscript g has been omitted from the term symbols for clarity.
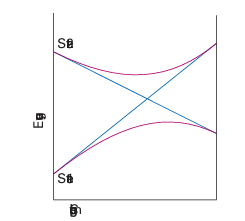
Figure 20.29 The noncrossing rule states that if two states of the same symmetry are likely to cross as a parameter is changed (as shown by the blue lines), they will in fact mix together and avoid the crossing (as shown by the brown lines).
A Tanabe Sugano diagram also provides some understanding of the widths of some absorption lines. Consider Fig. 20.28 and the 3T2g ←3T1g and 3A2g ←3T1g transitions. The line representing 3T2g is not parallel to that representing the ground state 3T1g , and so any variation in the value of ∆O (such as those caused by molecular vibration) results in a change in the energy of the transition and thus a broadening of the absorption band. The line representing 3A2g is even less parallel to the line representing 3T1g ; the energy of this transition will be affected even more by variations in ∆O and will thus be even broader. By contrast, the line representing the lower 1T2g term is almost parallel to that representing 3T1g and thus the energy of this transition is largely unaffected by variations in ∆O and the absorption is consequently very sharp (albeit weak, because it is forbidden).
 الاكثر قراءة في مواضيع عامة في الكيمياء العضوية
 اخر الاخبار
اخبار العتبة العباسية المقدسة


