
Single-crystal X-ray diffraction
 المؤلف:
Peter Atkins, Tina Overton, Jonathan Rourke, Mark Weller, and Fraser Armstrong
المؤلف:
Peter Atkins, Tina Overton, Jonathan Rourke, Mark Weller, and Fraser Armstrong
 المصدر:
Shriver and Atkins Inorganic Chemistry ,5th E
المصدر:
Shriver and Atkins Inorganic Chemistry ,5th E
 الجزء والصفحة:
ص225-226
الجزء والصفحة:
ص225-226
 2025-09-01
 406
406
Single-crystal X-ray diffraction
Key point: The analysis of the diffraction patterns obtained from single crystals allows the full determination of the structure. Analysis of the diffraction data obtained from single crystals is the most important method of obtaining the structures of inorganic solids. Provided a compound can be grown as a
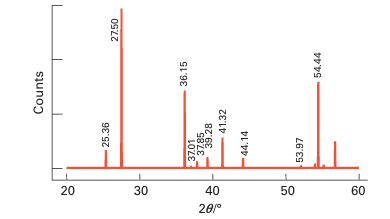
Figure 8.4 A powder diffraction pattern obtained from a mixture of TiO2 polymorphs (see Example 8.1).
crystal of sufficient size and quality, the data provide definitive information about molecular and extended lattice structures. The collection of diffraction data from a single crystal is normally carried out by using a four-circle or area-detector diffractometer (Fig. 8.5). A four-circle diffractometer uses a scintillation detector to measure the diffracted X-ray beam intensity as a function of the angles shown in the illustration. An area-detector diffractometer uses an image plate that is sensitive to X-rays and so can measure a large number of diffraction maxima simultane ously; many new systems use this technology because the data can typically be collected in just a few hours (Fig. 8.6). Analysis of the diffraction data from single crystals is formally a complex process in volving the locations and intensities of many thousands of reflections, but with increasing advances in computation power a skilled crystallographer can complete the structure de termination of a small inorganic molecule in under an hour. Single-crystal X-ray diffraction can be used to determine the structures of the vast majority of inorganic compounds when they can be obtained as crystals with dimensions of about 50x50x50 μm or larger. Positions for most atoms, including C, N, O, and metals, in most inorganic compounds can be determined with sufficient accuracy that bond lengths can be defined to within a fraction of a picometre. As an example, the S-S bond length in monoclinic sulfur has been reported as 204.7+/-0.3 pm.
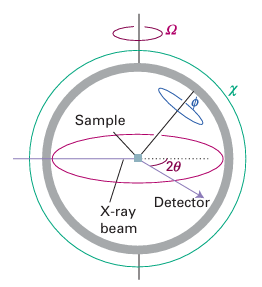
Figure 8.5 The layout of a four-circle diffractometer. A computer controls the location of the detector as the four angles are changed systematically.
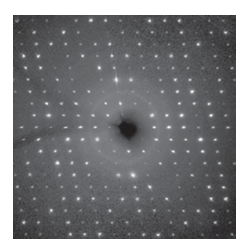
Figure 8.6 Part of a single-crystal X-ray diffraction pattern. Individual spots arise by diffraction of X-rays scattered from different planes of atoms within the crystal.
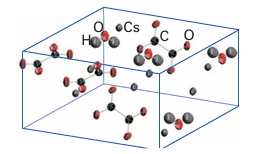
Figure 8.7 An ORTEP diagram of caesium oxalate monohydrate, Cs2C2O4 .H2O. The ellipsoids correspond to a 90 per cent probability of locating the atoms.
 الاكثر قراءة في مواضيع عامة في الكيمياء العضوية
 اخر الاخبار
اخبار العتبة العباسية المقدسة


