Quality Control
Within batch, between batch, external Each blood test result produced by an accredited laboratory will have quality control procedures in place to ensure that inevitable variations in machine, staff, and temperature do not affect the result.
Within batch variation
This is used to evaluate how good the technique is at giving the same result for identical samples in one attempt. This method often identifies whether a machine has bias towards a certain location on the rotor. Figure 1.1 shows a typical rotor which has 11 samples ready to analyse. H and L are primary standards and each yellow circle represents the same sample in replicate With the results from the experiment we can calculate the mean and standard deviation (SD) of the 9 identical yellow samples. Using the mean and standard deviation we can calculate the %Coefficient of Variance (CV)= ((SD /Mean)x100). This data is used to create the Y-Axis of a control plot. A common misconception is that a low CV is by default better than a higher one. The most important thing is that to consider is if the CV changes.
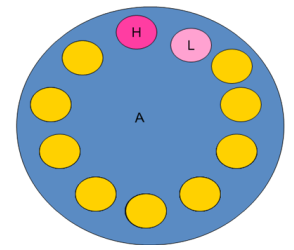
Figure 1.1: Within batch variation
Between batch variation This is used to evaluate how good the technique is at giving the same result on separate attempts. It is used to evaluate for example, if the machine or indeed a different operator will give a different result at a different time. Figure 1.2 shows the next two rotors done after our within batch test. They too have H and L standards (primary) and the same yellow sample we used for within batch (secondary) and it is this data (either from the primary, secondary, or both) which is used to create the X-Axis of a control plot (see 1.5) However, we also have the green sample which are different patient’s samples and the control plot will inform the service if the green results are suitable to be released as accurate.
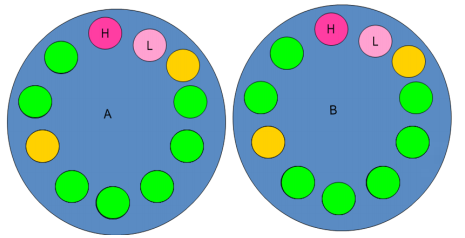
Figure 1.2: Between batch variation
External quality control This is used to evaluate if you get a different result if the test is done at a different site. Typically, a national organisation will send the same sample to different laboratories accredited to produce blood results and measure how similar the returned result is


