
Grammar


Tenses


Present

Present Simple

Present Continuous

Present Perfect

Present Perfect Continuous


Past

Past Simple

Past Continuous

Past Perfect

Past Perfect Continuous


Future

Future Simple

Future Continuous

Future Perfect

Future Perfect Continuous


Parts Of Speech


Nouns

Countable and uncountable nouns

Verbal nouns

Singular and Plural nouns

Proper nouns

Nouns gender

Nouns definition

Concrete nouns

Abstract nouns

Common nouns

Collective nouns

Definition Of Nouns

Animate and Inanimate nouns

Nouns


Verbs

Stative and dynamic verbs

Finite and nonfinite verbs

To be verbs

Transitive and intransitive verbs

Auxiliary verbs

Modal verbs

Regular and irregular verbs

Action verbs

Verbs


Adverbs

Relative adverbs

Interrogative adverbs

Adverbs of time

Adverbs of place

Adverbs of reason

Adverbs of quantity

Adverbs of manner

Adverbs of frequency

Adverbs of affirmation

Adverbs


Adjectives

Quantitative adjective

Proper adjective

Possessive adjective

Numeral adjective

Interrogative adjective

Distributive adjective

Descriptive adjective

Demonstrative adjective


Pronouns

Subject pronoun

Relative pronoun

Reflexive pronoun

Reciprocal pronoun

Possessive pronoun

Personal pronoun

Interrogative pronoun

Indefinite pronoun

Emphatic pronoun

Distributive pronoun

Demonstrative pronoun

Pronouns


Pre Position


Preposition by function

Time preposition

Reason preposition

Possession preposition

Place preposition

Phrases preposition

Origin preposition

Measure preposition

Direction preposition

Contrast preposition

Agent preposition


Preposition by construction

Simple preposition

Phrase preposition

Double preposition

Compound preposition

prepositions


Conjunctions

Subordinating conjunction

Correlative conjunction

Coordinating conjunction

Conjunctive adverbs

conjunctions


Interjections

Express calling interjection

Phrases

Sentences

Clauses

Part of Speech


Grammar Rules

Passive and Active

Preference

Requests and offers

wishes

Be used to

Some and any

Could have done

Describing people

Giving advices

Possession

Comparative and superlative

Giving Reason

Making Suggestions

Apologizing

Forming questions

Since and for

Directions

Obligation

Adverbials

invitation

Articles

Imaginary condition

Zero conditional

First conditional

Second conditional

Third conditional

Reported speech

Demonstratives

Determiners

Direct and Indirect speech


Linguistics

Phonetics

Phonology

Linguistics fields

Syntax

Morphology

Semantics

pragmatics

History

Writing

Grammar

Phonetics and Phonology

Semiotics


Reading Comprehension

Elementary

Intermediate

Advanced


Teaching Methods

Teaching Strategies

Assessment
The Reader Knows Little or Nothing
المؤلف:
BARBARA MINTO
المصدر:
THE MINTO PYRAMID PRINCIPLE
الجزء والصفحة:
230-12
2024-10-07
1538
The Reader Knows Little or Nothing
The DDT document was a situation in which the reader knew both the problem and the solution. Very often, however, you will write to get approval for a solution when the reader does not know the problem, so that it has to be explained in detail. Here the temptation is to want to describe how the system works now and all the things wrong ·with it before getting to the changes you intend to recommend.
The rule on introductions says that we cannot say anything in the introduction that the reader does not know or will not accept as true. But you can say enough to enable the reader to "see" that a problem could exist, and that the solution you have could be plausible, however, to be able to do so you need first to make sure that you yourself "see" the problem clearly.
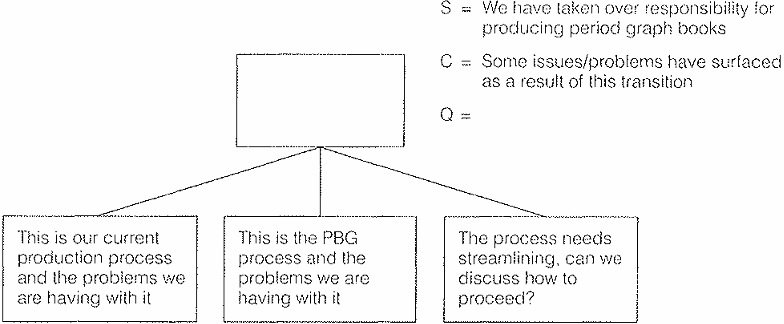
To illustrate, look at the Period Graph Books memorandum in Exhibit B-5. It describes in great detail the problems with a system for producing period graph books. The graphs show monthly sales, cost, and profit performance for a company's five subsidiaries, and are used as the basis for presentations to top management. Its structure is shown below.

You will note that it does not give a solution, other than to say that the system needs "streamlining." As a rule of thumb, you never want to present problems without also offering solutions. In any case, as we shall see, the solutions are inherent in the statement of the problems if that is done properly. The steps would be to:
- Draw a picture of the present processes
- State what is wrong with each
- Draw a picture of the system required to eliminate the problems
- State the changes needed to get from the old system to the new one
- Explain the problem succinctly in the introduction
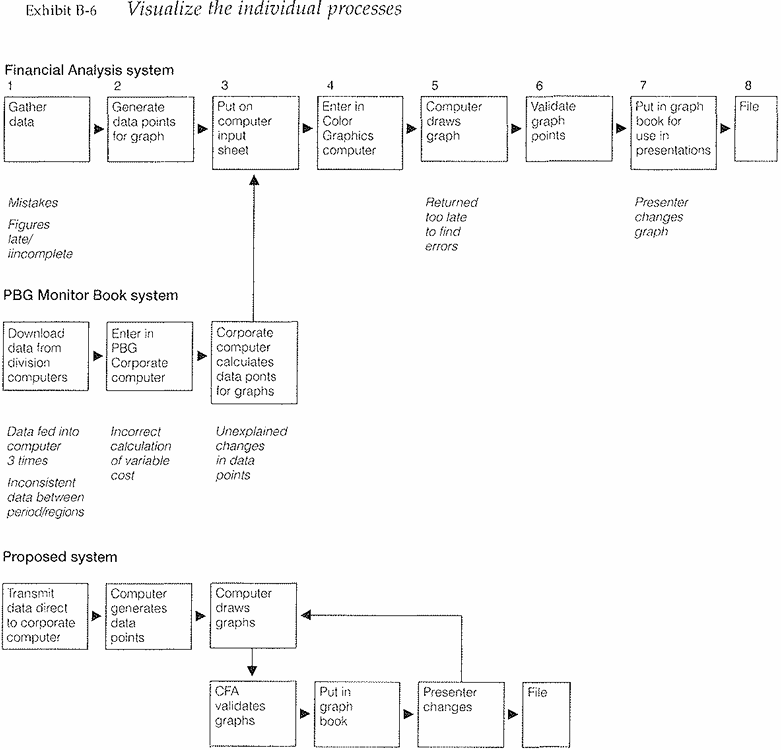
Exhibit 13-6 shows what the pictures would look like in this case.
Exhibit B-5 The process is over-described
TO:
FROM:
SUBJECT: Period Graph Books
As you aware, commencing in Period 5 the Corporate Financial Analysis Department assumed responsibility for The production phase of four graph presentation books from the Corporate Planning Department. The purpose of this memo is to outline some of issues/problem that have surfaced as a result of this transition.
Production
In order to address these issues more clearly, I will briefly outline the production phase as it currently exists. Specific activities are as follows:
1- Data gathering … Base data sources consist of external reports (e.g. “p” forms). internal division documents, and information relayed verbally from the division via telephone
2- Specific data point generation - involves either manual or computerized (PBG only) calculations For example, rolling 13 revenues, costs, and percentages (e.g. .. A&M as% of Net Sales)
3- Transcribe data points to input sheets - John Brennan’s area supplies computer printouts of data points YTO and analysts update it for latest period’s data. There is one computer page for each graph and generally each graph requires 2 new data points - actual and rolling 13. These input sheets upon completion, are returned for updating the Color Graphics' data base.
4- Data validation - Check for reasonableness and ensure consistency of calculations
Issues
The basic issues concerns the overall control from the point of obtaining divisional information to the actual generation of graphs. With respect to the four books transferred to the Corporate Analysis Group, this has made the control even more difficult, as it has injected one more individual into the process, and it has served to further fragment and abet an inefficient system.
In support of this. I will outline the process for the PBG monitor book and some of the related problems. The majority of PBG's monitor book calculations are computerized on a Corporate System designed solely for PBG due to the massive amount of calculations needed, since approximately 3 graphs are generated for each region.
The primary data source for input into this PBG Corporate System is the Division’s internals, which are computer outputs from their systems. These results are re-input into the Corporate PBG System. Which calculates roiling. YTD. per Case, and percentage data points to be used for the graphs. This Corporate Computer printout is used to provide data points for Color Graphics input sheets. The Color Graphics Department re-inputs these points into their data base and generates the graphs.
As described, the process involves divisional personnel and 3 Corporate departments - Planning. Financial Analysis, and Systems. The period data in one form or another is input into a computer system no less than three times. Thus, we have created a very inefficient system and have increased the potential for error due to the number of people involved and the related fragmentation
Some of the problems that we’ve encountered during the 7 periods that we’ve been involved are:
- Inconsistency of data input between periods and between regions
- Incorrect calculation of Variable Costs due to the original computer program design
- Unexplained changes in data points that were previously correct
- Data base was not updated for prior period’s information so that this information had to be posted again on the computer input sheets
Overall Assessment
The majority of these problems have arisen due to the cumbersome inefficient nature of the process itself. The fragmentation of the production process has resulted in no one person having control of the data and has created “gray areas” for which responsibility is unclear. The risk of potential errors has increased, as there is the chance that things will fall between the cracks.
The production process sorely needs streaming, both in terms of the individual books, as well as in terms of a base computer system that would efficiently execute all of the divisions’ common calculations. e.g. rolling data points Given our current staffing, we cannot handle the production streaming and control of the graph books.
At your convenience, can we discuss how to best proceed?
Exhibit B-6 shows what the pictures would look like in this case.

As you can see, there are two systems, one where the figures arc entered manually before being calculated, the other where they are downloaded from a computer. In the first system, mistakes are made because the data are gathered and entered manually, the figures are often late or incomplete, and frequently the graphs are returned by the computer too late to pick up errors in them. But even if the graphs are correct when put in the book, the presenter may arbitrarily decide to change them to show a clearer (or more desirable) trend line. In such cases he does not inform the staff group of the changes.
The PBG analysts are able to gather their data from divisional computers rather than manually. But it is re-fed separately into PEG's corporate computer and again into the Color Graphics computer. This leads to inconsistent data between periods and regions, and unexplained changes in data points that were previously correct.
Once the two systems are laid out and the problems with each identified, it is easy to see that the major problem is that the system produces unreliable graphs because errors occur: when the data are entered, when the data points are calculated, and when the presenters change the graphs.
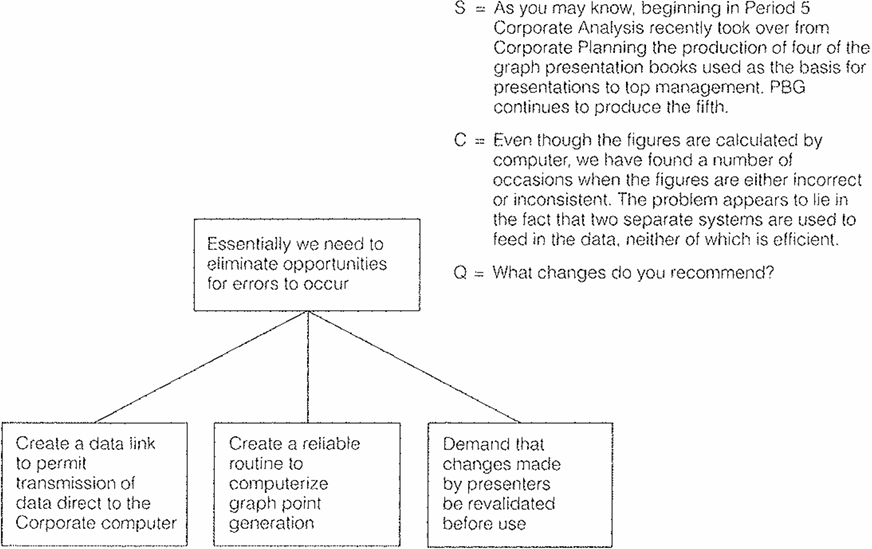
The person writing the memo thought they could eliminate the first two sets of problems by doing everything on the same computer, and the third by imposing discipline on the presenters. Visualizing the before, the after, and the differences between the two then makes it easy to specify the desired changes.
- Create a data link to permit transmission of the data direct to the Corporate computer
- Create a reliable routine to computerize graph point generation
- Demand that changes made by presenters be revalidated before use.
The changes will form the Key Line of the pyramid, answering the question, "What changes do you recommend?" It is now a simple matter to work backward to deter mine what information has to be communicated in the introduction to induce the reader to ask the question.

The question raised by each Key Line point would be "Why?", and underneath each point can be a detailed explanation of the undesirable way the system works now and how this action would eliminate the problem. What you do not have to do is explain every single step of the system-only those where a problem occurs-which greatly cuts down on the number of words required in the memo.
 الاكثر قراءة في Writing
 اخر الاخبار
اخبار العتبة العباسية المقدسة

الآخبار الصحية


 قسم الشؤون الفكرية يصدر كتاباً يوثق تاريخ السدانة في العتبة العباسية المقدسة
 "المهمة".. إصدار قصصي يوثّق القصص الفائزة في مسابقة فتوى الدفاع المقدسة للقصة القصيرة
 (نوافذ).. إصدار أدبي يوثق القصص الفائزة في مسابقة الإمام العسكري (عليه السلام)


