Frequency spectrum
 المؤلف:
Stan Gibilisco
 المصدر:
Teach Yourself Electricity and Electronics
 الجزء والصفحة:
170
 22-4-2021
 2522
2522
Frequency spectrum
An oscilloscope shows a graph of magnitude versus time. Because time is on the horizontal axis, the oscilloscope is said to be a time-domain instrument.
Sometimes you want to see magnitude as a function of frequency, rather than as a function of time. This can be done with a spectrum analyzer. It is a frequency-domain instrument with a cathode-ray display similar to an oscilloscope. Its horizontal axis shows frequency, from some adjustable minimum (extreme left) to some adjustable maximum (extreme right).
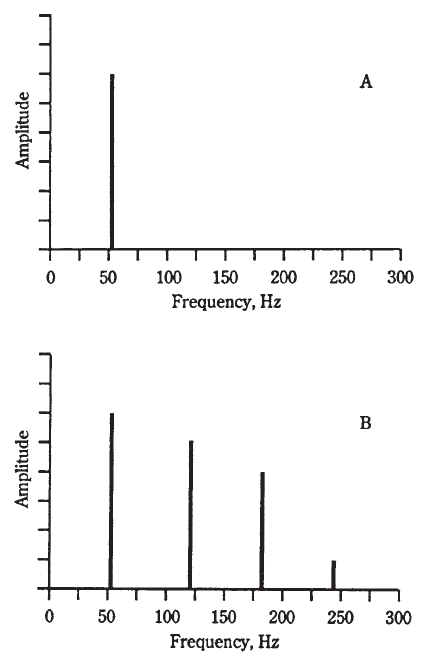
An ac sine wave, as displayed on a spectrum analyzer, appears as a single “pip, “ or vertical line (Fig. 1A). This means that all of the energy in the wave is concentrated at one single frequency.
Many ac waves contain harmonic energy along with the fundamental, or main, frequency. A harmonic frequency is a whole-number multiple of the fundamental frequency. For example, if 60 Hz is the fundamental, then harmonics can exist at 120 Hz, 180 Hz, 240 Hz, and so on. The 120-Hz wave is the second harmonic; the 180-Hz wave is the third harmonic.
In general, if a wave has a frequency equal to n times the fundamental, then that wave is the nth harmonic. In the illustration of Fig. 1B, a wave is shown along with several harmonics, as it would look on the display screen of a spectrum analyzer.
The frequency spectra of square waves and sawtooth waves contain harmonic energy in addition to the fundamental. The wave shape depends on the amount of energy in the harmonics, and the way in which this energy is distributed among the harmonic frequencies. A detailed discussion of these relationships is far too sophisticated for this book.
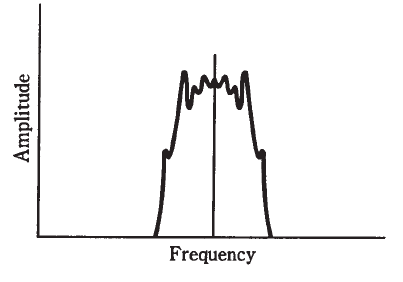
Irregular waves can have practically any imaginable frequency distribution. An example is shown at Fig. 2. This is a display of a voice-modulated radio signal. Much of the energy is concentrated at the center of the pattern, at the frequency shown by the vertical line. But there is also plenty of energy “splattered around” this carrier frequency.
On an oscilloscope, this signal would look like a fuzzy sine wave, indicating that it is ac, although it contains a potpourri of minor components.

Fig. 1: At A, pure 60-Hz sine wave on spectrum analyzer. At B, 60-Hz wave containing harmonics.

Fig. 2: Modulated radio signal on spectrum analyzer
 الاكثر قراءة في الألكترونيات
 اخر الاخبار
اخبار العتبة العباسية المقدسة


