علم الكيمياء

تاريخ الكيمياء والعلماء المشاهير
التحاضير والتجارب الكيميائية
المخاطر والوقاية في الكيمياء
اخرى
مقالات متنوعة في علم الكيمياء
كيمياء عامة
الكيمياء التحليلية
مواضيع عامة في الكيمياء التحليلية
التحليل النوعي والكمي
التحليل الآلي (الطيفي)
طرق الفصل والتنقية
الكيمياء الحياتية
مواضيع عامة في الكيمياء الحياتية
الكاربوهيدرات
الاحماض الامينية والبروتينات
الانزيمات
الدهون
الاحماض النووية
الفيتامينات والمرافقات الانزيمية
الهرمونات
الكيمياء العضوية
مواضيع عامة في الكيمياء العضوية
الهايدروكاربونات
المركبات الوسطية وميكانيكيات التفاعلات العضوية
التشخيص العضوي
تجارب وتفاعلات في الكيمياء العضوية
الكيمياء الفيزيائية
مواضيع عامة في الكيمياء الفيزيائية
الكيمياء الحرارية
حركية التفاعلات الكيميائية
الكيمياء الكهربائية
الكيمياء اللاعضوية
مواضيع عامة في الكيمياء اللاعضوية
الجدول الدوري وخواص العناصر
نظريات التآصر الكيميائي
كيمياء العناصر الانتقالية ومركباتها المعقدة
مواضيع اخرى في الكيمياء
كيمياء النانو
الكيمياء السريرية
الكيمياء الطبية والدوائية
كيمياء الاغذية والنواتج الطبيعية
الكيمياء الجنائية
الكيمياء الصناعية
البترو كيمياويات
الكيمياء الخضراء
كيمياء البيئة
كيمياء البوليمرات
مواضيع عامة في الكيمياء الصناعية
الكيمياء التناسقية
الكيمياء الاشعاعية والنووية

Control Charts
 المؤلف:
SOMENATH MITRA
المؤلف:
SOMENATH MITRA
 المصدر:
Sample Preparation Techniques in Analytical Chemistry
المصدر:
Sample Preparation Techniques in Analytical Chemistry
 الجزء والصفحة:
p 29
الجزء والصفحة:
p 29
 25-2-2018
 2086
2086


+
-
20
Control Charts
Control charts are used for monitoring the variability and to provide agr aph ical display of statistical control. Astandard, a reference material ofknown c oncentration, is analyzed at specified intervals (e.g., every 50 samples). The result should fall within a specified limit, as these are replicates.The only variation should be from random error. These results are plottedon a control chart to ensure that the random error is not increasing or that a ystematic bias is not taking place.
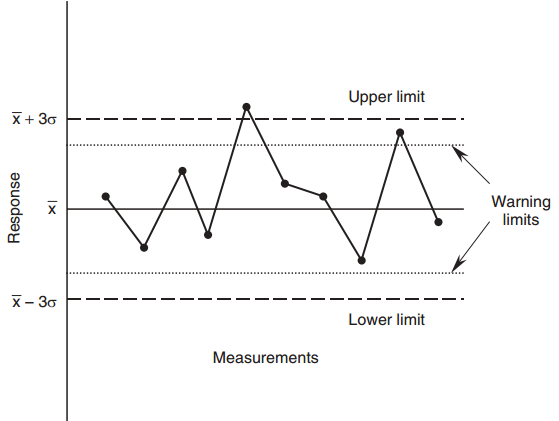
Figure 1.1.Control chart
In the control chart shown in Figure1.1, replicate measurements are plo tted as a function of time. The centerline is the average, or expected v alue . The upper (UCL) and lower (LCL)control limits are the values within which the measurements must fall. Normally, the control limits are ±3σ, within which 99.7% of the data should lie.For example, in a laboratory carrying out microwave extraction on a dailybasis, a standard reference material is extracted after a fixed number ofsamples. The measured value is plotted on the control chart. If it falls outside the control limit, readjustments are necessary to ensure that the processstays under control.
Control charts are used in many di¤erent applications besides analyticalm e asure ments. For example, in a manufacturing process, the control limitsar e often based on product quality. In analytical measurements, the contr ollimits can be established based on the analyst’s judgment and the experimental results. A common approach is to use the mean of select measurements as the centerline, and then a multiple of the standard deviation is usedto set the control limits. Control charts often plot regularly scheduled analysis of a standard reference material or an audit sample. These are thentracked to see if there is a trend or a systematic deviation from the centerline.
 الاكثر قراءة في مواضيع عامة في الكيمياء التحليلية
 اخر الاخبار
اخبار العتبة العباسية المقدسة

الآخبار الصحية


مواضيع ذات صلة
 قسم الشؤون الفكرية يصدر كتاباً يوثق تاريخ السدانة في العتبة العباسية المقدسة
 "المهمة".. إصدار قصصي يوثّق القصص الفائزة في مسابقة فتوى الدفاع المقدسة للقصة القصيرة
 (نوافذ).. إصدار أدبي يوثق القصص الفائزة في مسابقة الإمام العسكري (عليه السلام)