
Comparison of Variances
 المؤلف:
D. A. Skoog, F. J.Holler, D M. West, and S. R. Crouch
المؤلف:
D. A. Skoog, F. J.Holler, D M. West, and S. R. Crouch
 المصدر:
Fundamentals of Analytical Chemistry
المصدر:
Fundamentals of Analytical Chemistry
 الجزء والصفحة:
9th. p 138
الجزء والصفحة:
9th. p 138
 7-5-2017
 3163
3163
Comparison of Variances
At times, there is a need to compare the variances (or standard deviations) of two data sets. For example, the normal t test requires that the standard deviations of the data sets being compared are equal. A simple statistical test, called the F test, can be used to test this assumption under the provision that the populations follow the normal (Gaussian) distribution. The F test is also used in comparing more than two means and in linear regression analysis. The F test is based on the null hypothesis that the two population variances under consideration are equal, H0: σ21 = σ22. The test statistic F, which is defined as the ratio of the two sample variances (F = s21/s22), is calculated and compared with the critical value of F at the desired significance level. The null hypothesis is rejected if the test statistic differs too much from unity. Critical values of F at the 0.05 significance level are shown in Table 1.1. Note that two degrees of freedom are given, one associated with the numerator and the other with the denominator. Most mathematical handbooks give more extensive tables of F values at various significance levels. The F test can be used in either a one-tailed mode or in a two-tailed mode. For a onetailed test we test the alternative hypothesis that one variance is greater than the other. Hence, the variance of the supposedly more precise procedure is placed in the denominator and that of the less precise procedure is placed in the numerator. The alternative hypothesis is Ha: σ21 > σ22 .
The critical values of F for the 95% confidence level are given in Table 1.1. For a two-tailed test, we are testing whether the variances are different, Ha: σ21 ≠ σ22. For this application, the larger variance always appears in the numerator. This arbitrary placement of the larger variance in the numerator makes the outcome of the test less certain; thus, the uncertainty level of the F values in Table 1.1 is doubled from 5% to 10%. Example 1.1 illustrates the use of the F test for comparing measurement precision.
Table 1.1

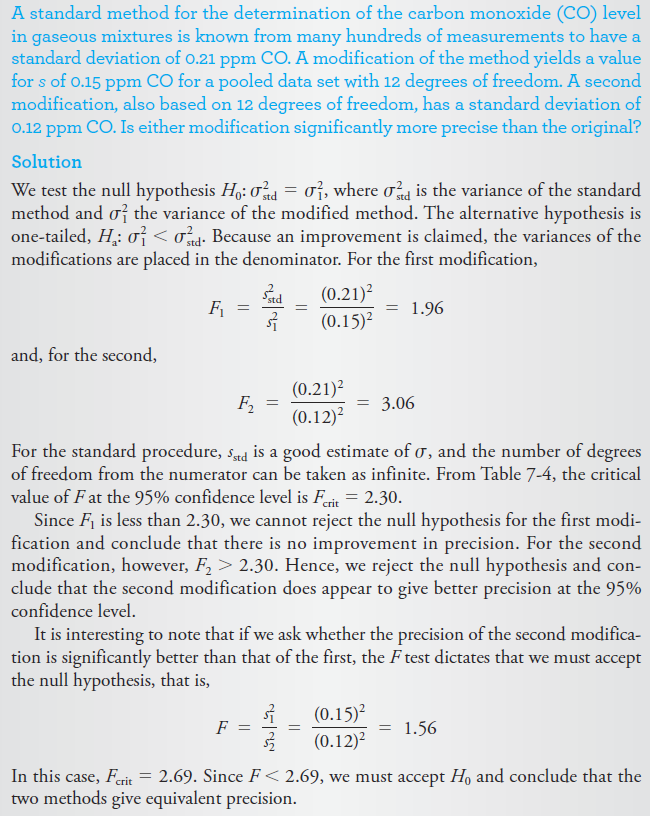
Example 1.1
 0
0
 0
0
 الاكثر قراءة في مواضيع عامة في الكيمياء التحليلية
 اخر الاخبار
اخبار العتبة العباسية المقدسة


