Finding Asymptotes
 المؤلف:
المرجع الالكتروني للمعلوماتيه
 المصدر:
www.almerja.com
 الجزء والصفحة:
...
 6-3-2017
 1958
1958
Definition: A straight line on a graph that represents a limit for a given function. Imagine a curve that comes closer and closer to a line without actually crossing it.
Example: The function y=1/x is a very simple asymptotic function. As x approaches positive infinity, y gets really close to 0. But, it never actually gets to zero. The curve of this function will look something like this, with a horizontal asymptote at y=0:

Let's take a more complicated example and find the asymptotes. Examine this function:

If you factor both the numerator and denominator in that function above, you will change the function from standard form to factored form. In the factored form, the above function will reveal two interesting things:
1) Location of any vertical asymptotes.
2) Location of any x-axis intercepts.
Here what the above function looks like in factored form:

Once the original function has been factored, the denominator roots will equal our vertical asymptotes and the numerator roots will equal our x-axis intercepts. This means that when the denominator equals zero we have found a vertical asymptote.
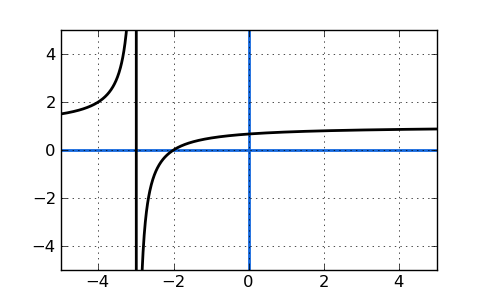
So, for what values of x is that function's denominator equal to zero? The answer is x=-3. Here's what happens: When x approaches -3, the denominator starts to get really small and approaches zero. Right? Well, as the denominator approaches zero, the whole function starts to blow up towards infinity. Try this out with something like x = -2.999 for proof.
When we plot the function, we'll see that the curve approaches an imaginary vertical line at x=-3.

While it looks like there's a solid line at x=-3, that doesn't actually exist and is just caused by the plotting program (most will do this unfortunately) connect two data points on either side of x=-3. That vertical line is the vertical asymptote x=-3.
 الاكثر قراءة في مواضيع عامة في الجبر
 اخر الاخبار
اخبار العتبة العباسية المقدسة


