Interferometric spectrophotometers
By far the most commonly encountered IR spectrometer in analytical laboratories is the Fourier transform (FTIR) spectrophotometer. FTIR spectrometers have the sample next to the detector after wavelength selection. This reduces heat effects from having a sample in proximity to an IR source. Locking into the mirror oscillation frequency coupled with the signal filtering associated with the Fourier transform and the improvements in optics and detectors makes this preferred sample position viable. The FTIR spectrometer incorporates an interferometer in place of a monochromator. The way a FTIR spectrometer operates is shown schematically in Fig. 1:
• If the mirror M1 is set to oscillate along the optic axis, the distance travelled by beam (B+ D) varies, while the distance travelled by (C+ E) remains unchanged.
• With identical (B D) and (C E) distances, D and E are in-phase and recombination is fully constructive. As mirror M1 moves towards the beam splitter, the beam D arrives ‘ahead’ of beam E; recombination is not fully constructive and the intensity of beam F is reduced and its phase changes. Eventually the mirror movement of M1 leads to beam D being a half wave ahead of beam E. The recombination is now fully destructive and the intensity of beam F becomes zero. At this point, the movement of M1 is reversed past the oscillation mid-point to eventually make D retarded compared to E, to give zero intensity at half-wave retardation before returning to the mid-point of the oscillation.
• As the mirror moves back and forth through a single mirror oscillation period, the intensity of a single wavelength of IR light varies considerably. In practice, all wavelengths are passing through the system simultaneously. Therefore, the total IR light intensity registered as falling on the detector during a single mirror oscillation period is very complicated and takes the form illustrated in Fig. 2.
• The signal illustrated in Fig. 2 is now subjected to a mathematical procedure called Fourier transformation. This extracts the light intensity versus wavelength (wavenumber) information.
• With no reference or sample in the beam, this measurement is the background or I0 spec trum, which is stored in the computer to be used as the I0 for all subsequent transmittance (It/I0) or absorbance [log(I0 /It)] measurements during the working session
• A measurement is now made with the sample in place. A similar interferogram is created. This is also subjected to Fourier transformation to produce a sample light-intensity throughput spectrum.
• Subsequent data manipulation in the computer produces the transmission or absorption spectrum of the sample.
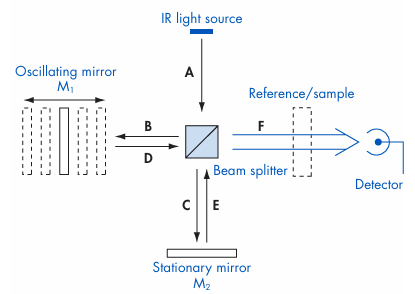
Figure 1 Layout of an IR interferometer (FTIR spectrometer).
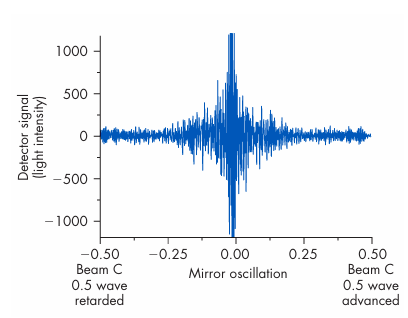
Figure 2 Interferogram produced by a single-mirror oscillation.