
The liquid–vapour boundary
 المؤلف:
Peter Atkins، Julio de Paula
المؤلف:
Peter Atkins، Julio de Paula
 المصدر:
ATKINS PHYSICAL CHEMISTRY
المصدر:
ATKINS PHYSICAL CHEMISTRY
 الجزء والصفحة:
ص127-129
الجزء والصفحة:
ص127-129
 2025-11-12
 184
184
The liquid–vapour boundary
The entropy of vaporization at a temperature T is equal to ∆vapH/T; the Clapeyron equation for the liquid–vapour boundary is therefore
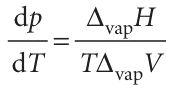
The enthalpy of vaporization is positive; ∆vapV is large and positive. Therefore, dp/dT is positive, but it is much smaller than for the solid–liquid boundary. It follows that dT/dp is large, and hence that the boiling temperature is more responsive to pressure than the freezing temperature.

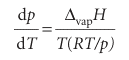
Because the molar volume of a gas is so much greater than the molar volume of a liquid, we can write ∆vapV ≈ Vm(g) (as in Example 4.2). Moreover, if the gas behaves perfectly, Vm(g) = RT/p. These two approximations turn the exact Clapeyron equation into
which rearranges into the Clausius–Clapeyron equation for the variation of vapour pressure with temperature:
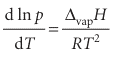
(We have used dx/x = d ln x.) Like the Clapeyron equation, the Clausius–Clapeyron equation is important for understanding the appearance of phase diagrams, particularly the location and shape of the liquid–vapour and solid–vapour phase boundaries. It lets us predict how the vapour pressure varies with temperature and how the boiling temperature varies with pressure. For instance, if we also assume that the enthalpy of vaporization is independent of temperature, this equation can be integrated as follows:
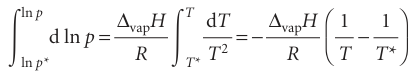
Where p* is the vapour pressure when the temperature is T* and p the vapour pressure when the temperature is T. Therefore, because the integral on the left evaluates to ln(p/p*), the two vapour pressures are related by
Equation 4.12 is plotted as the liquid–vapour boundary in Fig. 4.14. The line does not extend beyond the critical temperature Tc, because above this temperature the liquid does not exist.
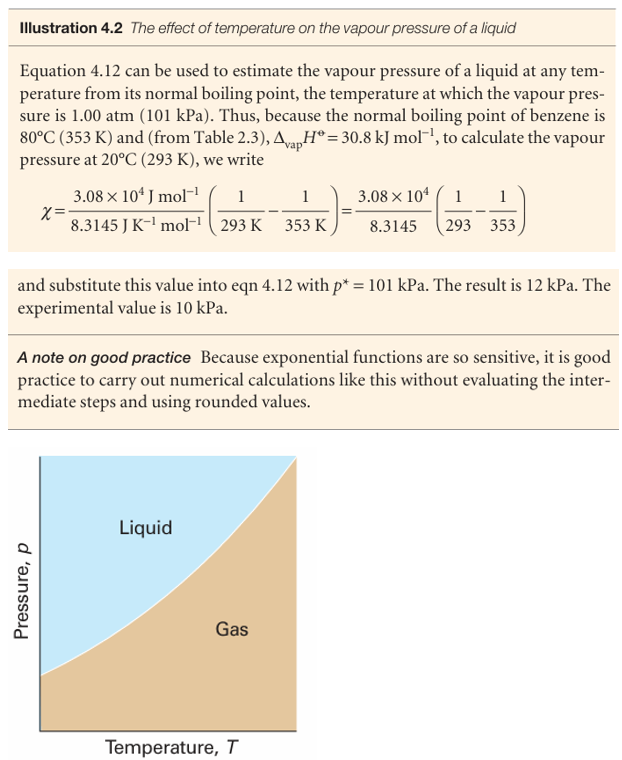
Fig. 4.14 A typical liquid–vapour phase boundary. The boundary can be regarded as a plot of the vapour pressure against the temperature. Note that, in some depictions of phase diagrams in which a logarithmic pressure scale is used, the phase boundary has the opposite curvature (see Fig. 4.7). This phase boundary terminates at the critical point (not shown).
 الاكثر قراءة في مواضيع عامة في الكيمياء الفيزيائية
 اخر الاخبار
اخبار العتبة العباسية المقدسة


