Least Squares Fitting
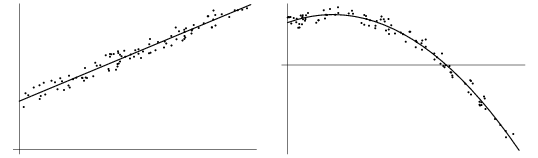
A mathematical procedure for finding the best-fitting curve to a given set of points by minimizing the sum of the squares of the offsets ("the residuals") of the points from the curve. The sum of the squares of the offsets is used instead of the offset absolute values because this allows the residuals to be treated as a continuous differentiable quantity. However, because squares of the offsets are used, outlying points can have a disproportionate effect on the fit, a property which may or may not be desirable depending on the problem at hand.
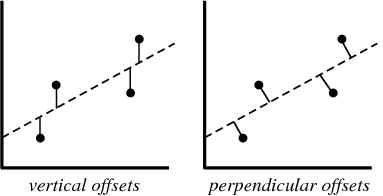
In practice, the vertical offsets from a line (polynomial, surface, hyperplane, etc.) are almost always minimized instead of the perpendicular offsets. This provides a fitting function for the independent variable  that estimates
  for a given
  (most often what an experimenter wants), allows uncertainties of the data points along the
  - and
- and  -axes to be incorporated simply, and also provides a much simpler analytic form for the fitting parameters than would be obtained using a fit based on perpendicular offsets. In addition, the fitting technique can be easily generalized from a best-fit line to a best-fit polynomial when sums of vertical distances are used. In any case, for a reasonable number of noisy data points, the difference between vertical and perpendicular fits is quite small.
The linear least squares fitting technique is the simplest and most commonly applied form of linear regression and provides a solution to the problem of finding the best fitting straight line through a set of points. In fact, if the functional relationship between the two quantities being graphed is known to within additive or multiplicative constants, it is common practice to transform the data in such a way that the resulting line is a straight line, say by plotting  vs.
vs.  instead of
  vs.
vs.  in the case of analyzing the period
  of a pendulum as a function of its length
  . For this reason, standard forms for exponential, logarithmic, and power laws are often explicitly computed. The formulas for linear least squares fitting were independently derived by Gauss and Legendre.
For nonlinear least squares fitting to a number of unknown parameters, linear least squares fitting may be applied iteratively to a linearized form of the function until convergence is achieved. However, it is often also possible to linearize a nonlinear function at the outset and still use linear methods for determining fit parameters without resorting to iterative procedures. This approach does commonly violate the implicit assumption that the distribution of errors is normal, but often still gives acceptable results using normal equations, a pseudoinverse, etc. Depending on the type of fit and initial parameters chosen, the nonlinear fit may have good or poor convergence properties. If uncertainties (in the most general case, error ellipses) are given for the points, points can be weighted differently in order to give the high-quality points more weight.
Vertical least squares fitting proceeds by finding the sum of the squares of the vertical deviations  of a set of
  data points
![R^2=sum[y_i-f(x_i,a_1,a_2,...,a_n)]^2](https://mathworld.wolfram.com/images/equations/LeastSquaresFitting/NumberedEquation1.gif) |
(1)
|
from a function  . Note that this procedure does not minimize the actual deviations from the line (which would be measured perpendicular to the given function). In addition, although the unsquared sum of distances might seem a more appropriate quantity to minimize, use of the absolute value results in discontinuous derivatives which cannot be treated analytically. The square deviations from each point are therefore summed, and the resulting residual is then minimized to find the best fit line. This procedure results in outlying points being given disproportionately large weighting.
The condition for  to be a minimum is that
 |
(2)
|
for  , ...,
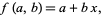
  . For a linear fit,
 |
(3)
|
so
![R^2(a,b)=sum_(i=1)^n[y_i-(a+bx_i)]^2](https://mathworld.wolfram.com/images/equations/LeastSquaresFitting/NumberedEquation4.gif) |
(4)
|
![(partial(R^2))/(partiala)=-2sum_(i=1)^n[y_i-(a+bx_i)]=0](https://mathworld.wolfram.com/images/equations/LeastSquaresFitting/NumberedEquation5.gif) |
(5)
|
![(partial(R^2))/(partialb)=-2sum_(i=1)^n[y_i-(a+bx_i)]x_i=0.](https://mathworld.wolfram.com/images/equations/LeastSquaresFitting/NumberedEquation6.gif) |
(6)
|
These lead to the equations
In matrix form,
![[n sum_(i=1)^(n)x_i; sum_(i=1)^(n)x_i sum_(i=1)^(n)x_i^2][a; b]=[sum_(i=1)^(n)y_i; sum_(i=1)^(n)x_iy_i],](https://mathworld.wolfram.com/images/equations/LeastSquaresFitting/NumberedEquation7.gif) |
(9)
|
so
![[a; b]=[n sum_(i=1)^(n)x_i; sum_(i=1)^(n)x_i sum_(i=1)^(n)x_i^2]^(-1)[sum_(i=1)^(n)y_i; sum_(i=1)^(n)x_iy_i].](https://mathworld.wolfram.com/images/equations/LeastSquaresFitting/NumberedEquation8.gif) |
(10)
|
The  matrix inverse is
![[a; b]=1/(nsum_(i=1)^(n)x_i^2-(sum_(i=1)^(n)x_i)^2)[sum_(i=1)^(n)y_isum_(i=1)^(n)x_i^2-sum_(i=1)^(n)x_isum_(i=1)^(n)x_iy_i; nsum_(i=1)^(n)x_iy_i-sum_(i=1)^(n)x_isum_(i=1)^(n)y_i],](https://mathworld.wolfram.com/images/equations/LeastSquaresFitting/NumberedEquation9.gif) |
(11)
|
so
(Kenney and Keeping 1962). These can be rewritten in a simpler form by defining the sums of squares
which are also written as
Here,  is the covariance and
  and
and  are variances. Note that the quantities
  and
and  can also be interpreted as the dot products
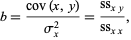
In terms of the sums of squares, the regression coefficient  is given by
 |
(27)
|
and  is given in terms of
  using (◇) as
 |
(28)
|
The overall quality of the fit is then parameterized in terms of a quantity known as the correlation coefficient, defined by
 |
(29)
|
which gives the proportion of  which is accounted for by the regression.
Let  be the vertical coordinate of the best-fit line with
  -coordinate
  , so
, so
 |
(30)
|
then the error between the actual vertical point  and the fitted point is given by
 |
(31)
|
Now define  as an estimator for the variance in
  ,
,
 |
(32)
|
Then  can be given by
 |
(33)
|
(Acton 1966, pp. 32-35; Gonick and Smith 1993, pp. 202-204).
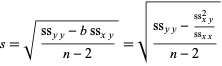
The standard errors for  and
and  are
are
REFERENCES:
Acton, F. S. Analysis of Straight-Line Data. New York: Dover, 1966.
Bevington, P. R. Data Reduction and Error Analysis for the Physical Sciences. New York: McGraw-Hill, 1969.
Chatterjee, S.; Hadi, A.; and Price, B. "Simple Linear Regression." Ch. 2 in Regression Analysis by Example, 3rd ed. New York: Wiley, pp. 21-50, 2000.
Edwards, A. L. "The Regression Line  on
on  ." Ch. 3 in An Introduction to Linear Regression and Correlation. San Francisco, CA: W. H. Freeman, pp. 20-32, 1976.
Farebrother, R. W. Fitting Linear Relationships: A History of the Calculus of Observations 1750-1900. New York: Springer-Verlag, 1999.
Gauss, C. F. "Theoria combinationis obsevationum erroribus minimis obnoxiae." Werke, Vol. 4. Göttingen, Germany: p. 1, 1823.
Gonick, L. and Smith, W. The Cartoon Guide to Statistics. New York: Harper Perennial, 1993.
Kenney, J. F. and Keeping, E. S. "Linear Regression, Simple Correlation, and Contingency." Ch. 8 in Mathematics of Statistics, Pt. 2, 2nd ed. Princeton, NJ: Van Nostrand, pp. 199-237, 1951.
Kenney, J. F. and Keeping, E. S. "Linear Regression and Correlation." Ch. 15 in Mathematics of Statistics, Pt. 1, 3rd ed. Princeton, NJ: Van Nostrand, pp. 252-285, 1962.
Lancaster, P. and Šalkauskas, K. Curve and Surface Fitting: An Introduction. London: Academic Press, 1986.
Laplace, P. S. "Des méthodes analytiques du Calcul des Probabilités." Ch. 4 in Théorie analytique des probabilités, Livre 2, 3rd ed. Paris: Courcier, 1820.
Lawson, C. and Hanson, R. Solving Least Squares Problems. Englewood Cliffs, NJ: Prentice-Hall, 1974.
Ledvij, M. "Curve Fitting Made Easy." Industrial Physicist 9, 24-27, Apr./May 2003.
Nash, J. C. Compact Numerical Methods for Computers: Linear Algebra and Function Minimisation, 2nd ed. Bristol, England: Adam Hilger, pp. 21-24, 1990.
Press, W. H.; Flannery, B. P.; Teukolsky, S. A.; and Vetterling, W. T. "Fitting Data to a Straight Line" "Straight-Line Data with Errors in Both Coordinates," and "General Linear Least Squares." §15.2, 15.3, and 15.4 in Numerical Recipes in FORTRAN: The Art of Scientific Computing, 2nd ed. Cambridge, England: Cambridge University Press, pp. 655-675, 1992.
Whittaker, E. T. and Robinson, G. "The Method of Least Squares." Ch. 9 in The Calculus of Observations: A Treatise on Numerical Mathematics, 4th ed. New York: Dover, pp. 209-, 1967.
York, D. "Least-Square Fitting of a Straight Line." Canad. J. Phys. 44, 1079-1086, 1966.


